
by Chris Kimble | Feb 6, 2015 | Kimble Charting, Sector / Commodity
CLICK ON CHART TO ENLARGE The strategy I use is called TBNM, which stands for “Tops, Bottoms and No Middles!” I hope to find key turning/inflection points, because if correct on the read, sweet risk/reward situations present themselves. I am of the...
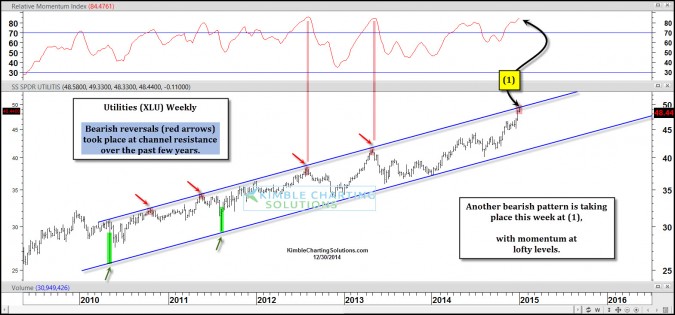
by Chris Kimble | Dec 30, 2014 | Kimble Charting, Sector / Commodity
CLICK ON CHART TO ENLARGE When it comes to juiced up performance in 2014, Utilities come to mind. Utilities ETF XLU is up just short of 30% on the year (see performance here, click on YTD) This strong rally has XLU up against 5-year channel resistance, with...

by Chris Kimble | Dec 11, 2014 | Kimble Charting, Sector / Commodity
CLICK ON CHART TO ENLARGE When is comes to cause and effect, the U.S. Dollar seems to be having a profound impact on commodities over the past three years. This 5-pack takes a look at the U.S. Dollar and a few key commodities. The upper left chart reflects that...

by Chris Kimble | Nov 18, 2014 | Kimble Charting, Sector / Commodity
CLICK ON CHART TO ENLARGE Is it time for the U.S. Dollar & Euro to change their current trend? My first thought would be “what trend?” Many talk about the big moves in the U.S. Dollar and Euro and I just want to scratch my head and say,...

by Chris Kimble | Jan 15, 2014 | Kimble Charting, Sector / Commodity
CLICK ON CHART TO ENLARGE Ever heard of the idea of buy low & sell higher? Believe in it? If not quit reading now! If you do believe in the idea of buy low & sell higher or believe in buying assets that are out of favor, the above chart might be of...
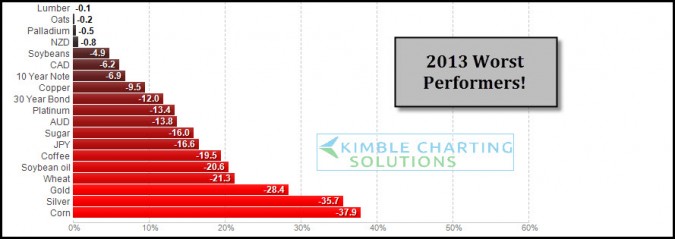
by Chris Kimble | Dec 23, 2013 | Kimble Charting, Sector / Commodity
CLICK ON CHART ENLARGE 2013 has been good for stocks, the above table reflects its not been the best of years for certain assets. These are the worst performers so far YTD. As 2013 is nearing a close I wanted to share these worst performers and apply some Power of the...

by Chris Kimble | Oct 22, 2013 | Kimble Charting, Sector / Commodity
CLICK ON CHART TO ENLARGE The above 6-pack reflects a wide variety of bonds and yields. The upper left two charts highlights heavy falling channel resistance in the 10 & 30-year yield, which are now breaking support. The other 4 charts high light breakouts in...

by Chris Kimble | Oct 9, 2013 | Global Dashboard, Kimble Charting, Sector / Commodity
These triplets may not have been planned…. but our “Triple Play Advantage” was! What is the “Triple Play Advantage?” If you become a member of one of our weekly research reports, you can get two more weekly research reports at 50%...
