by Chris Kimble | Feb 22, 2018 | Kimble Charting
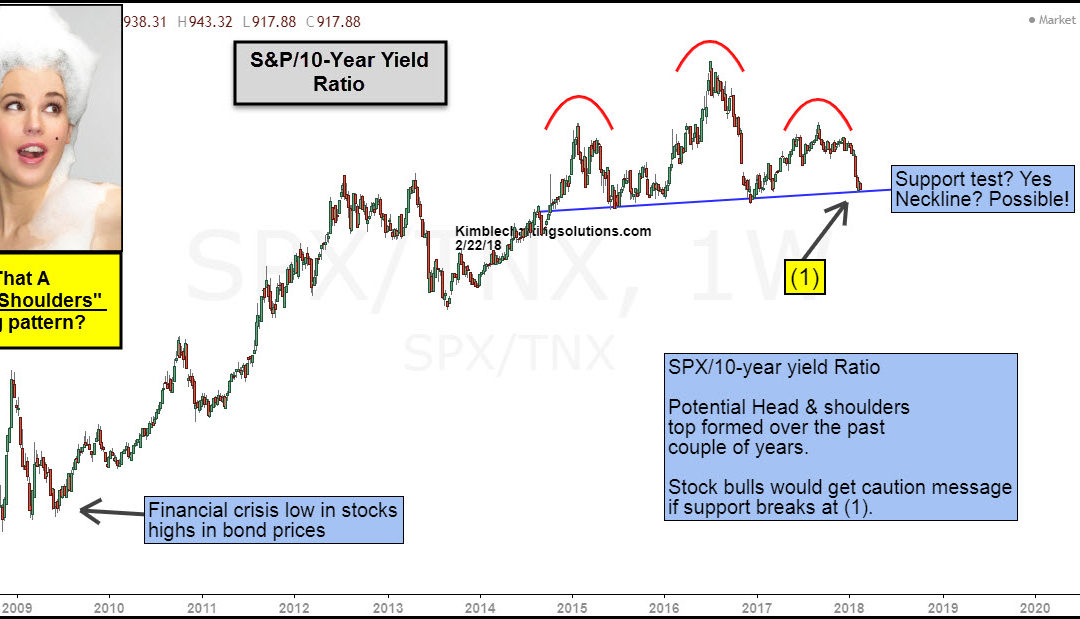
CLICK ON CHART TO ENLARGE The above chart takes a look at the S&P 500/10-year Yield (TNX) ratio over the past 10-years. At the time of the financial crisis lows, the ratio itself was very low and created a series of higher lows in 2009, before embarking on a...
by Chris Kimble | Feb 12, 2018 | Kimble Charting
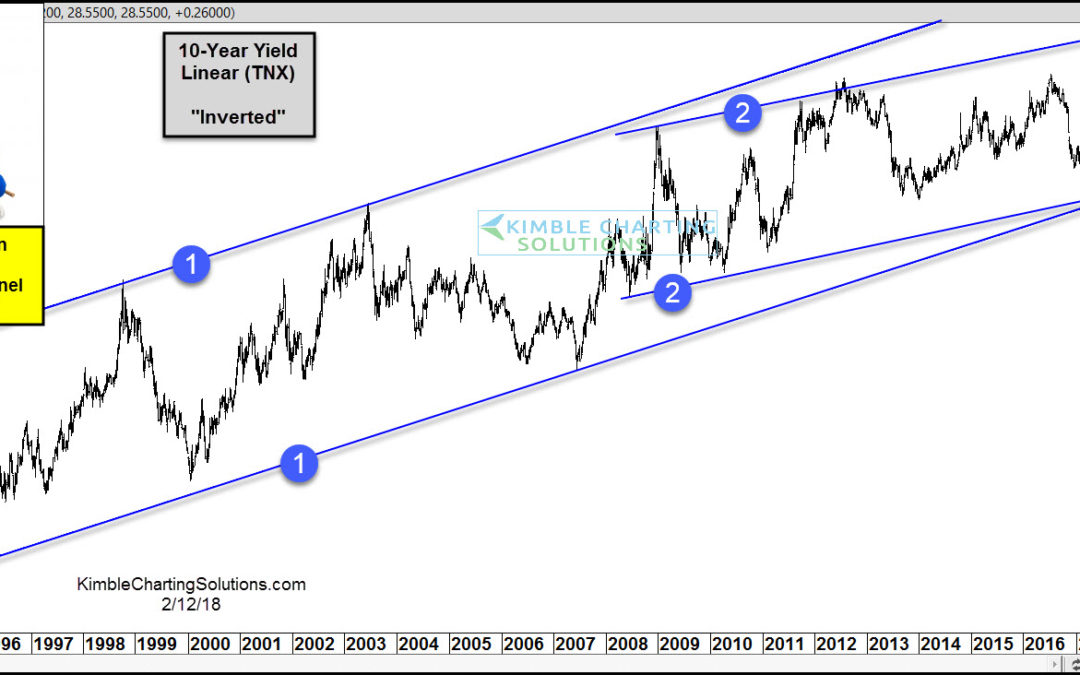
The chart above looks at the yield on the 10-year note (TNX) “Inverted.” The 10-year yield has remained inside of rising channel (1) for the past 25-years and rising channel (2) for the past 10-years. Will the Plunge Protection Team come to the rescue at...

by Chris Kimble | Feb 8, 2018 | Kimble Charting
Rising interest rates are finally getting some attention here, and by all accounts, investors are concerned! The rate with which treasury yields have moved higher has caught many off guard and may be part of the recent uptick in market volatility. Will interest rates...
by Chris Kimble | Oct 25, 2017 | Kimble Charting
Interest rates based upon the 10-year yield (TNX) have been heading lower for years, more than 25-years actually. Below looks at the yield on the 10-year note and reflects that an important and rare test is in play. CLICK ON CHART TO ENLARGE Yields on the 10-year note...

by Chris Kimble | Jan 27, 2017 | Kimble Charting
If I told you that some assets have done really well post election, would that surprise you or the majority? Nah! What assets have done well post election or seem to be in the news of late? A strong rise in Banks, Materials, Energy and Interest Rates are just a few...

by Chris Kimble | Dec 19, 2016 | Kimble Charting
Have interest rates rallied in a “Big” way over the past 20-weeks? How about the largest 20-week rally in history! Have rates peaked in the short-term or going to continue higher? Below looks at the yield on the 10-year note, over the past 30-years. CLICK...

by Chris Kimble | Dec 6, 2016 | Kimble Charting
Interest rates have shot up since this past July. Have they “stretched too far too fast?” One way to measure if an asset has made a rare/extreme short-term move, is too see how far above or below its 200 day moving average, it is. Below looks at the yield...

by Chris Kimble | Dec 2, 2016 | Kimble Charting
The talk over the past couple of months has been, interest rates are rising and the Fed will raise rates very soon. Joe Friday feels a big test is in play, before one can say the “rate trend has changed!” Below looks at the yield on the 10-year note, over...
