by Chris Kimble | Mar 21, 2019 | Kimble Charting
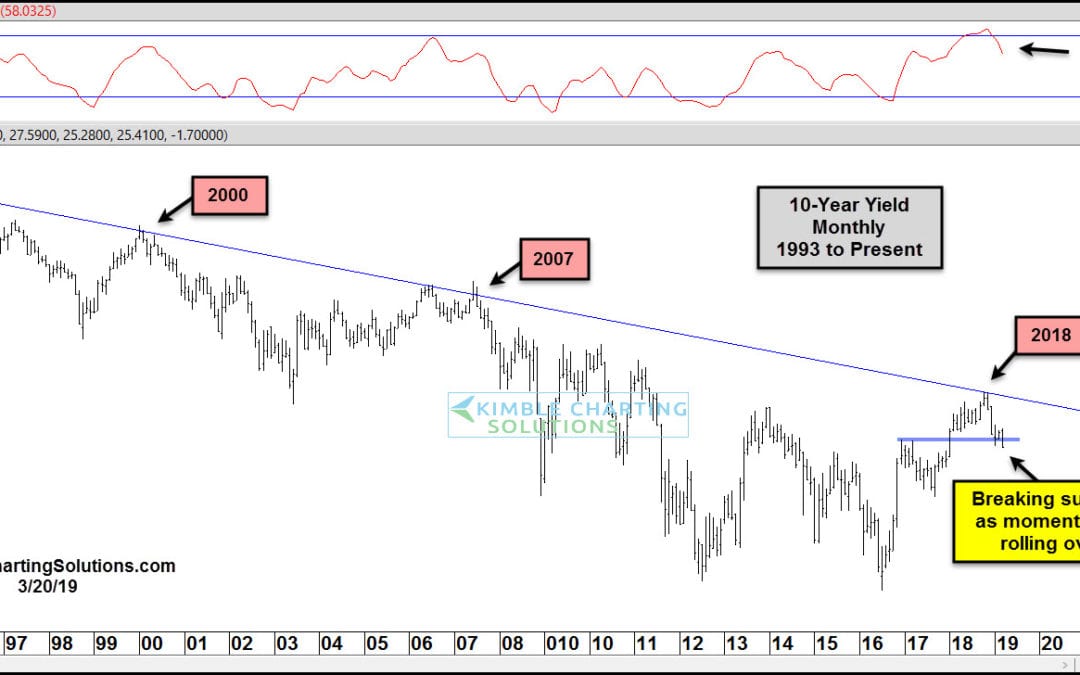
The Federal Reserve wasn’t quite as hawkish as investors expected. The result: Treasury bond yields (interest rates) fell sharply. In today’s chart of the 10-Year US Treasury Yield, we highlight the reversal in rates that occurred late last year. This wasn’t just any...
by Chris Kimble | Mar 8, 2019 | Kimble Charting
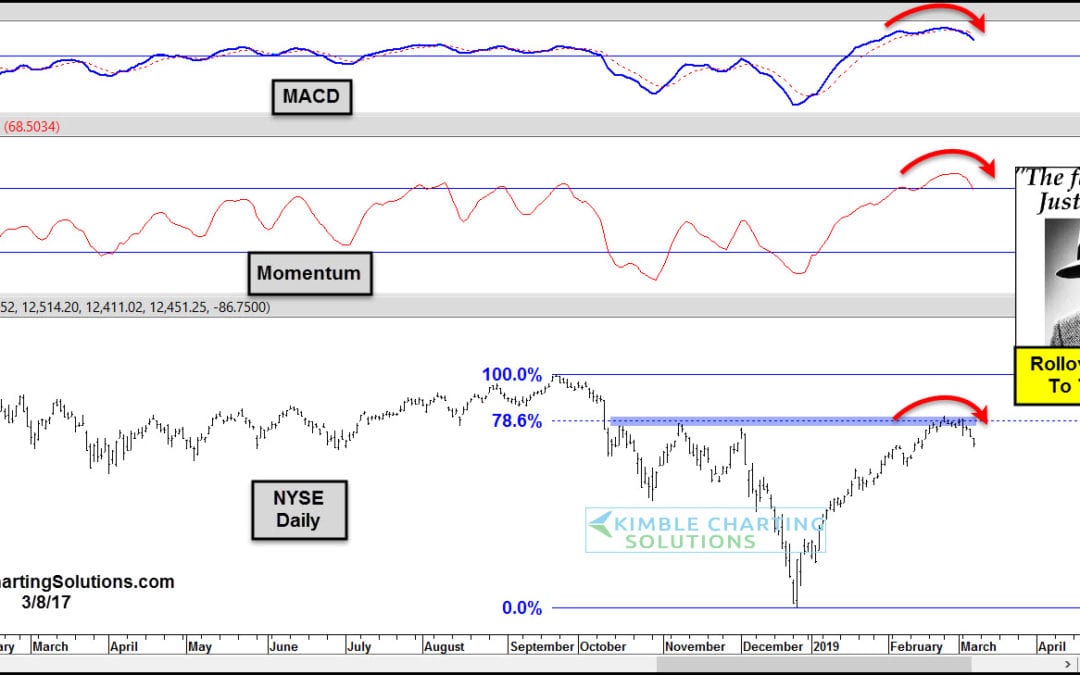
The NYSE Index is facing a very important price level as Momentum and the MACD are at the highest levels in a year! The 9-week rally from the late December lows has the NYSE index facing the October, November, December highs and its 78% retracement this past week. Joe...
by Chris Kimble | Feb 28, 2019 | Kimble Charting
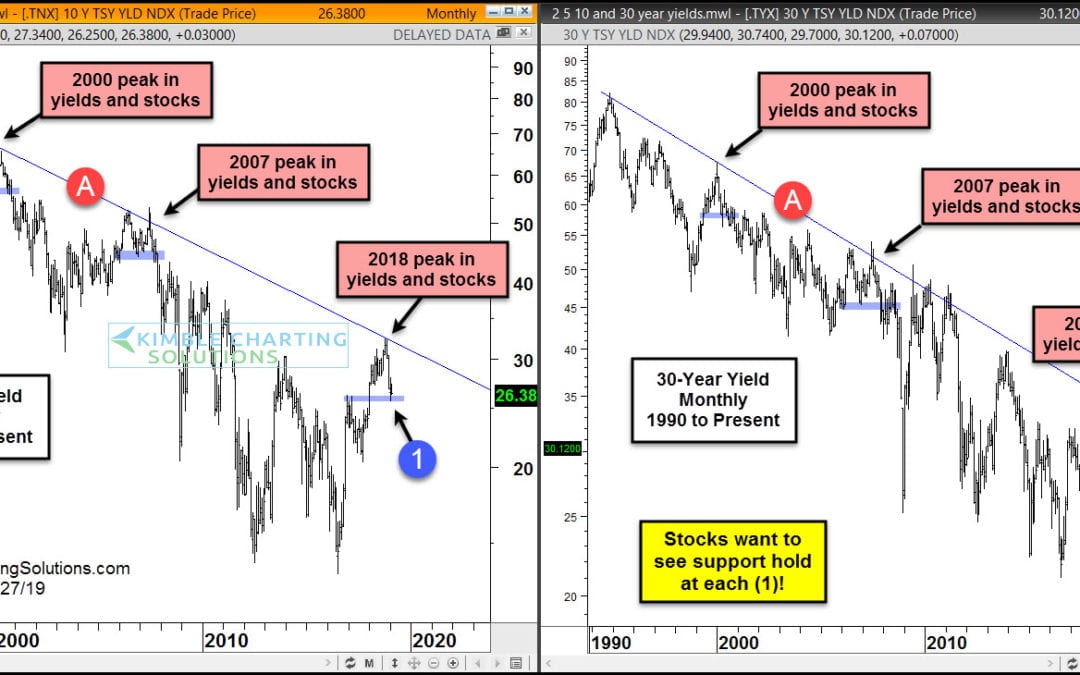
When the financial media talks about US Treasuries, it is usually focused on the yield curve. Or sometimes they will highlight the 10-year treasury yield and its relation to mortgage rates. But more recently, the news has been focused on the prospects of a yield curve...
by Chris Kimble | Jan 25, 2019 | Kimble Charting
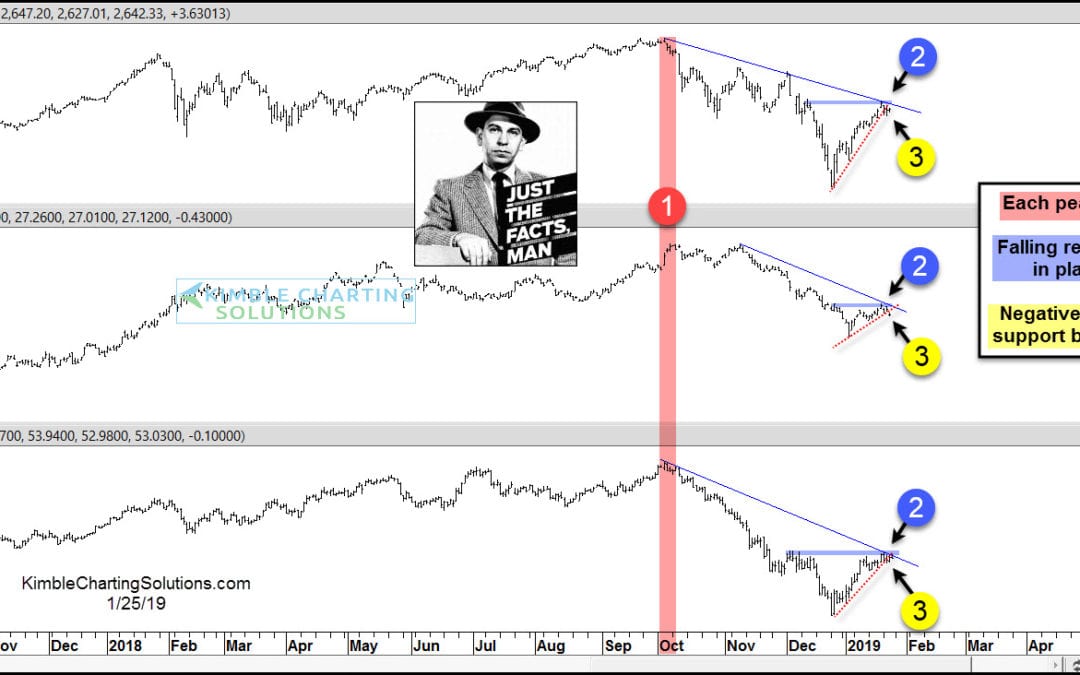
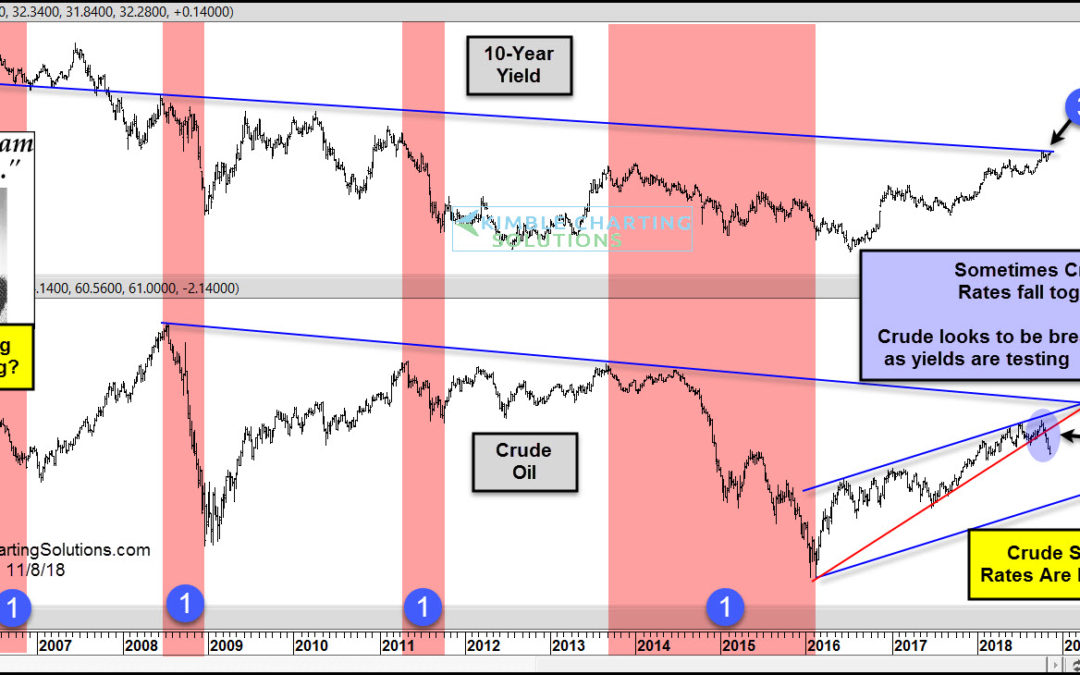
Stocks, Yields and Crude Oil have experienced a high degree of correlation since the October highs and each looks to be experiencing a key price test at the same time! The S&P 500, 10-year yields and Crude Oil hit highs at nearly the same time in early October at...
by Chris Kimble | Nov 9, 2018 | Kimble Charting
CLICK ON CHART TO ENLARGE Joe Friday suggested that Crude Oil could be peaking in the chart above first shared on 5/25/18, as Crude was testing its 50% retracement level at (2). Weakness in Crude of late has it down near 20% from recent highs. Crude is one of the...
by Chris Kimble | Jul 10, 2018 | Kimble Charting
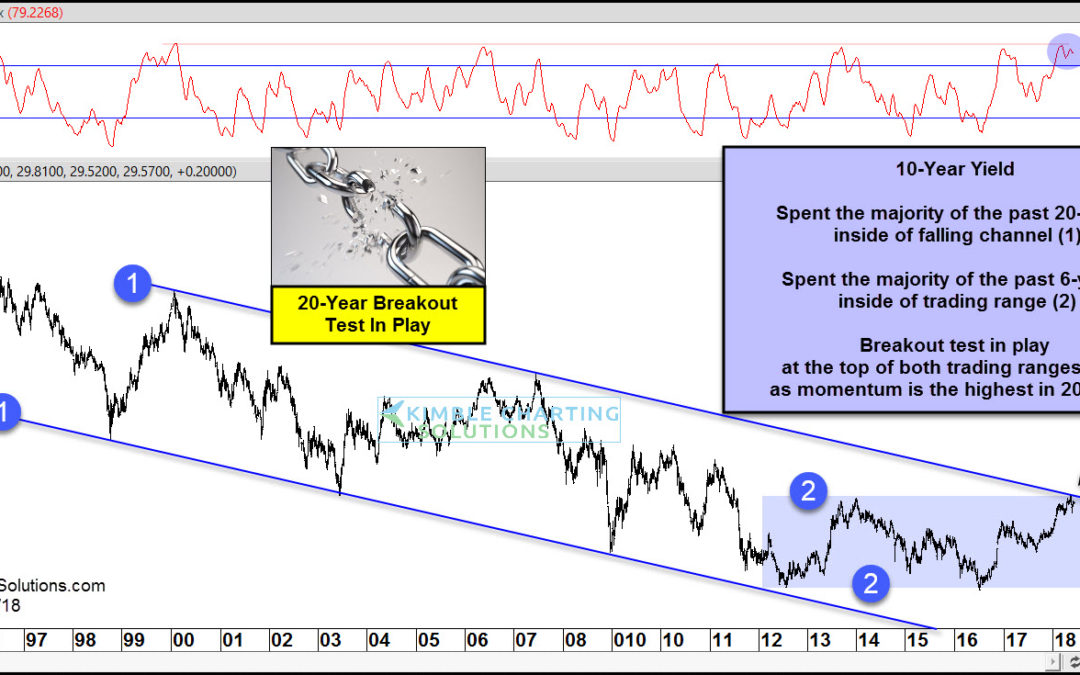
CLICK ON CHART TO ENLARGE This chart looks at the Yield on the 10-year note (TNX) over the past 25-years. Yields have spent the majority of the past couple of decades inside of falling channel (1). Yields have been pushing higher since the lows in 2016 where they have...
by Chris Kimble | Jun 13, 2018 | Kimble Charting
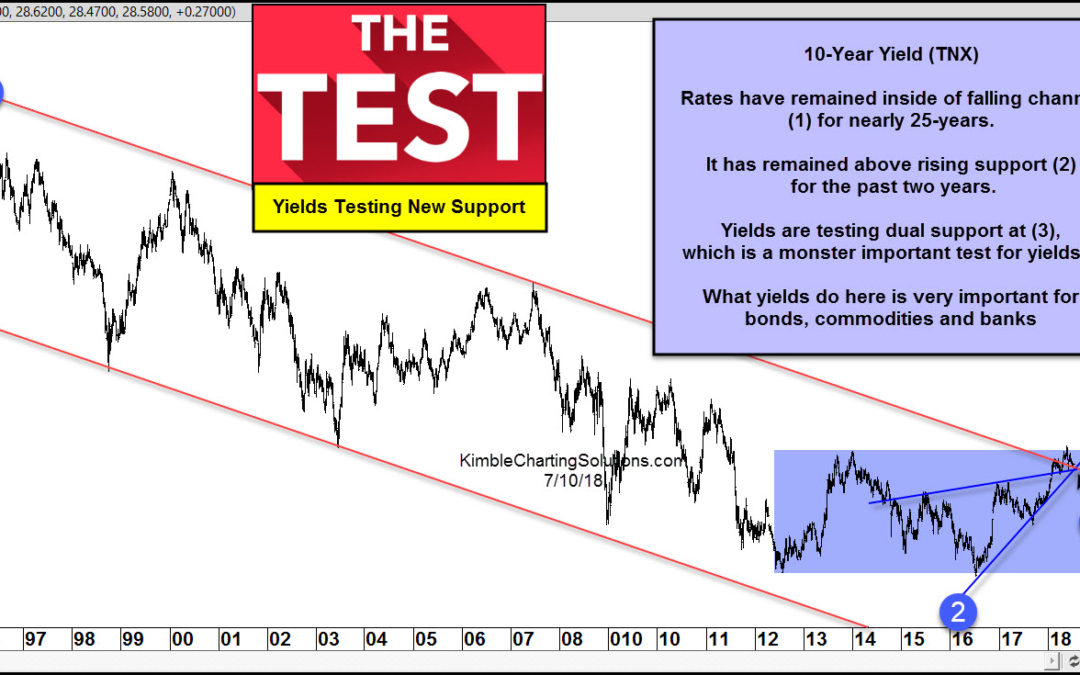
CLICK ON CHART TO ENLARGE The chart above looks at the yield on the 10-year note (TNX) over the past 25-years. The long-term trend is down as an important trend test is in play currently. The 10-year yield has spent the majority of the past 20-years inside of falling...
by Chris Kimble | Apr 24, 2018 | Kimble Charting
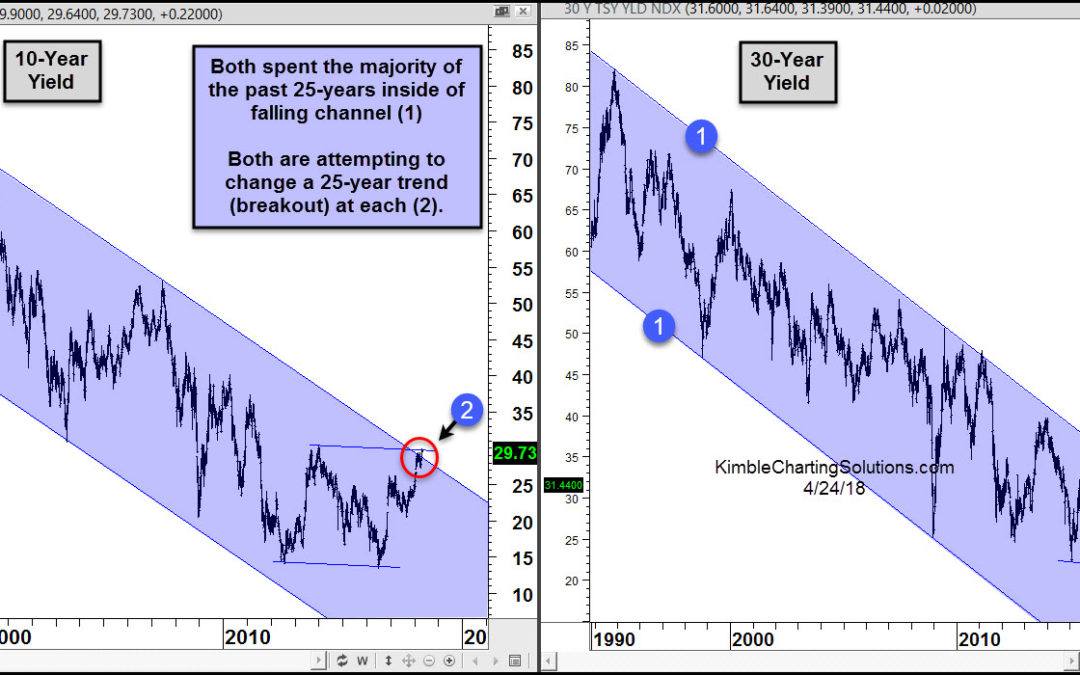
CLICK ON CHART TO ENLARGE Interest rates have been falling for nearly three decades. Could the trend of lower rates be over? A big test to this trend is in play right now! Above looks at 10 & 30-year yields since early 1990’s. Both have remained inside of...
