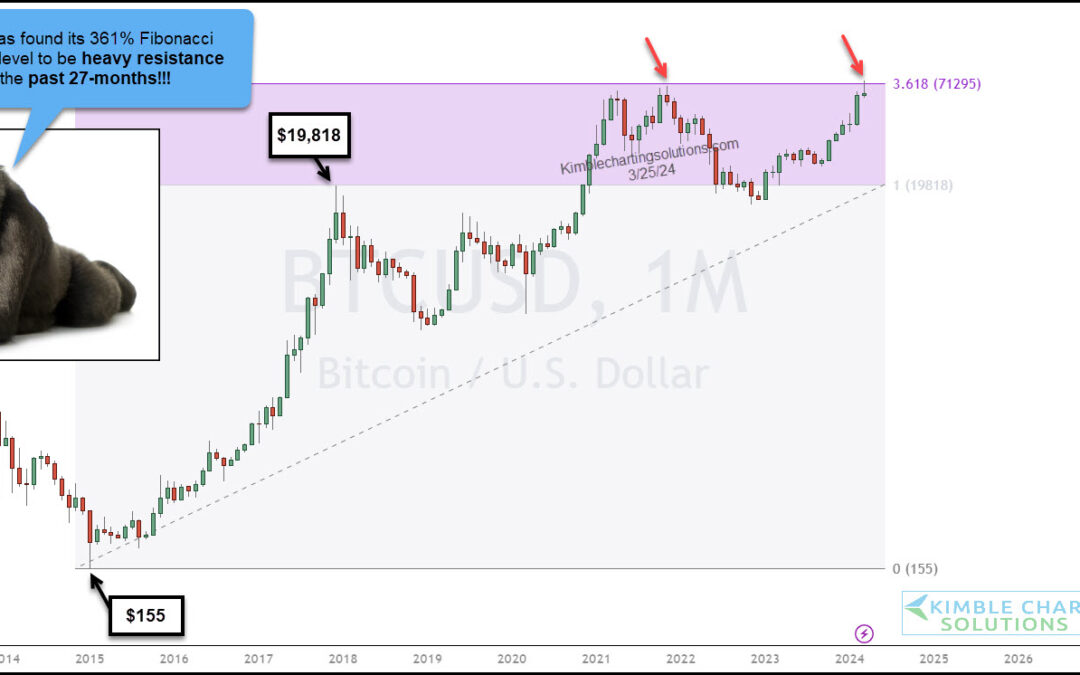
by Chris Kimble | Mar 26, 2024 | Kimble Charting
Bitcoin has struggle to overcome a very important price level for more than two years: the 1.618 Fibonacci extension level. This price area is especially important as it marked Bitcoin’s original all-time high in November 2021. We eclipsed that this month, but price...
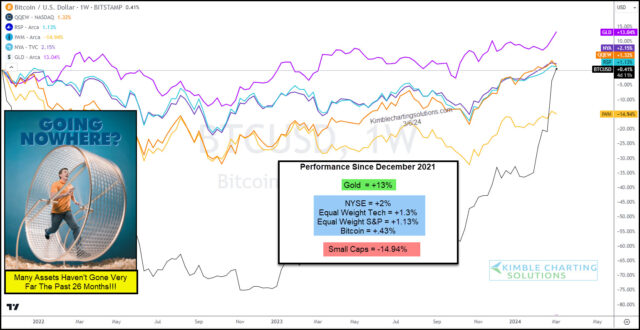
by Chris Kimble | Mar 8, 2024 | Kimble Charting
Several indicators of investor sentiment are showing rising “greed” levels. And when investors get greedy, it tends to imply that we are nearing a top. BUT, I am unsure why greed levels are so high when so many assets have little to brag about over the past few years!...
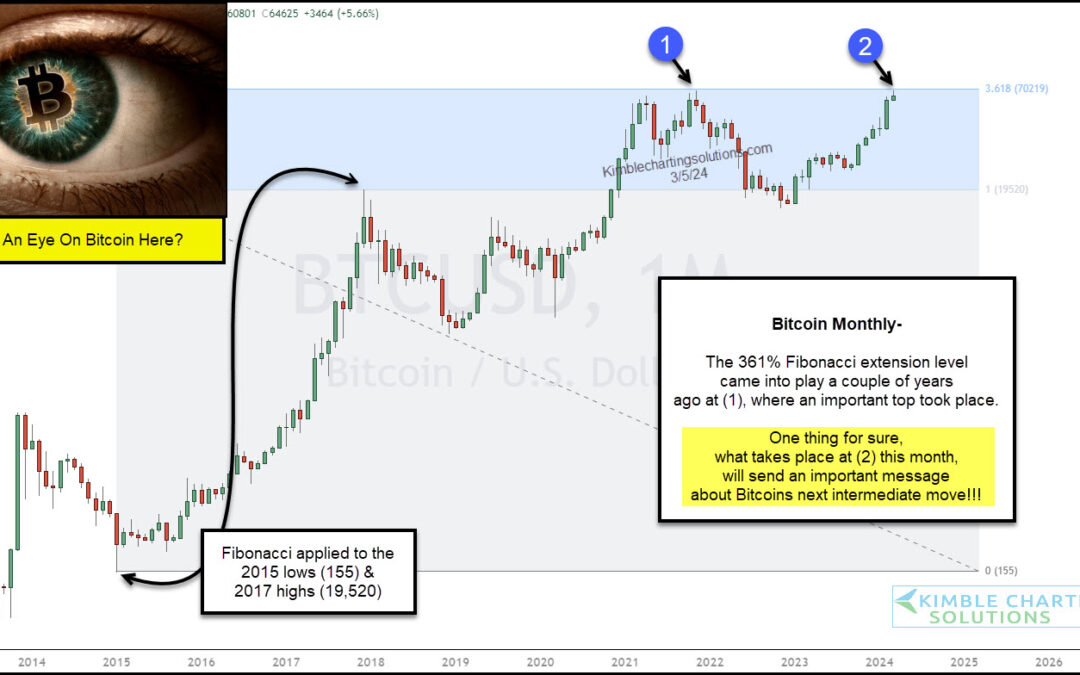
by Chris Kimble | Mar 6, 2024 | Kimble Charting
Bitcoin has been all the rage in the financial markets lately. After it surpassed 50000, headline after headline has come out about it making new all-time highs. Well it finally happened. And Bitcoin’s price has retreated a little since. As you can see on today’s...
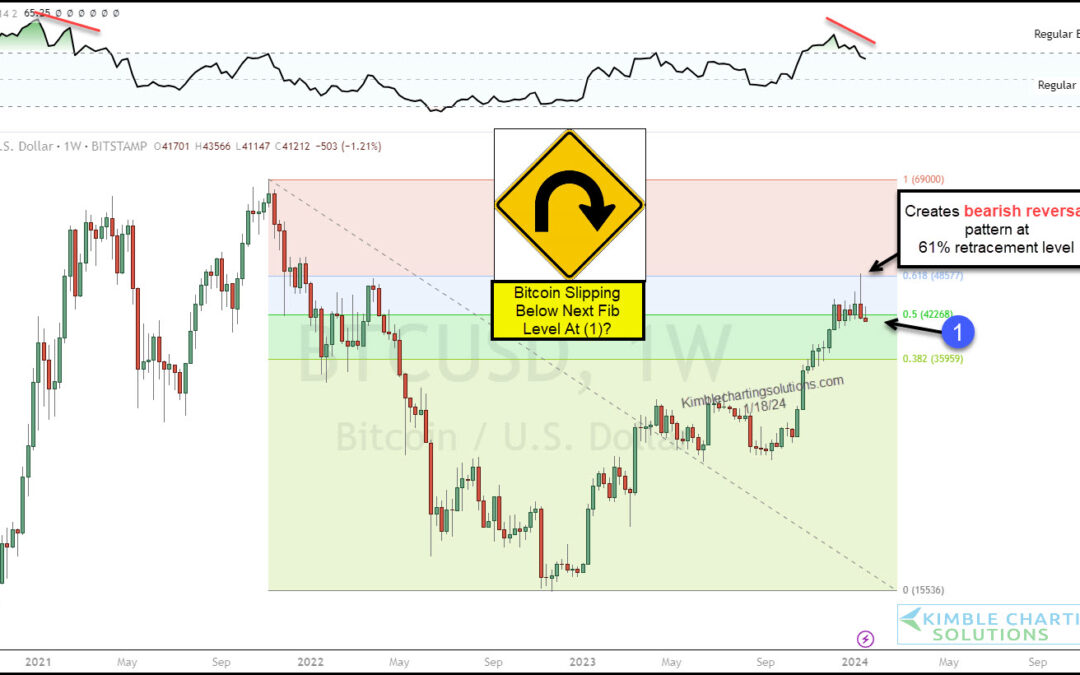
by Chris Kimble | Jan 22, 2024 | Kimble Charting
Bitcoin chatter is rising again. With new ETFs coming to market, crypto investors are getting very bullish. Is this a good thing? Or is too much bullishness about to send Bitcoin spiraling? Today we look at a long-term “weekly” chart with Fibonacci levels to show why...
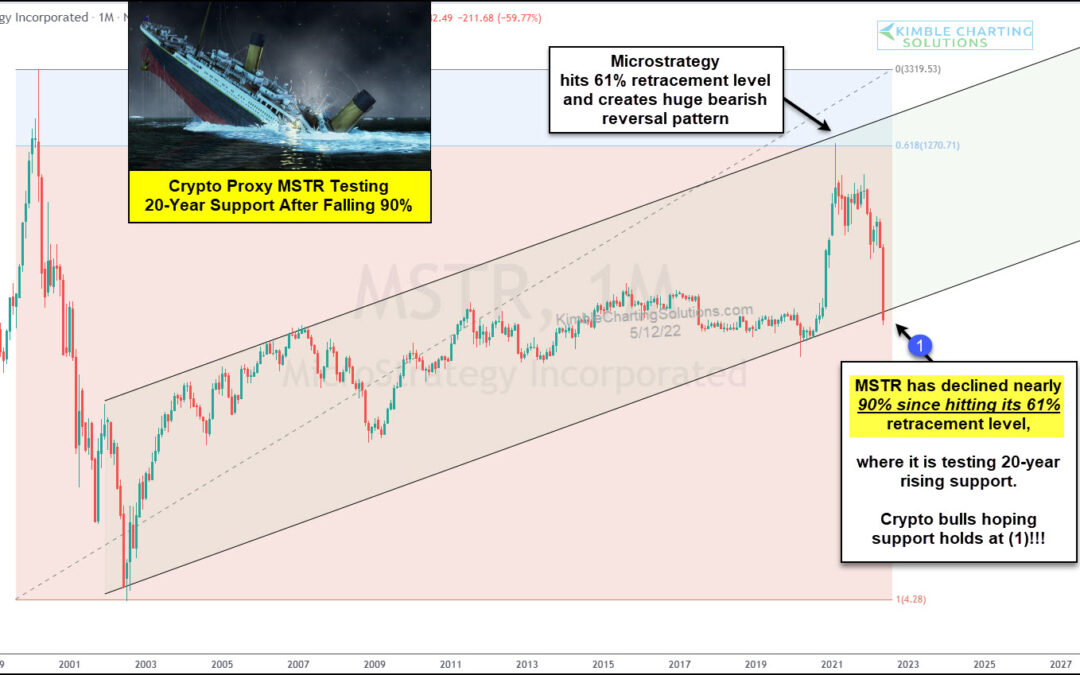
by Chris Kimble | May 13, 2022 | Kimble Charting
Microstrategy is a tech company selling its enterprise software solutions and analytics (platform)… but it is better known for something else… It’s CEO Michael Saylor is a bitcoin whale. And he has been investing significant amounts of the companies reserves in...
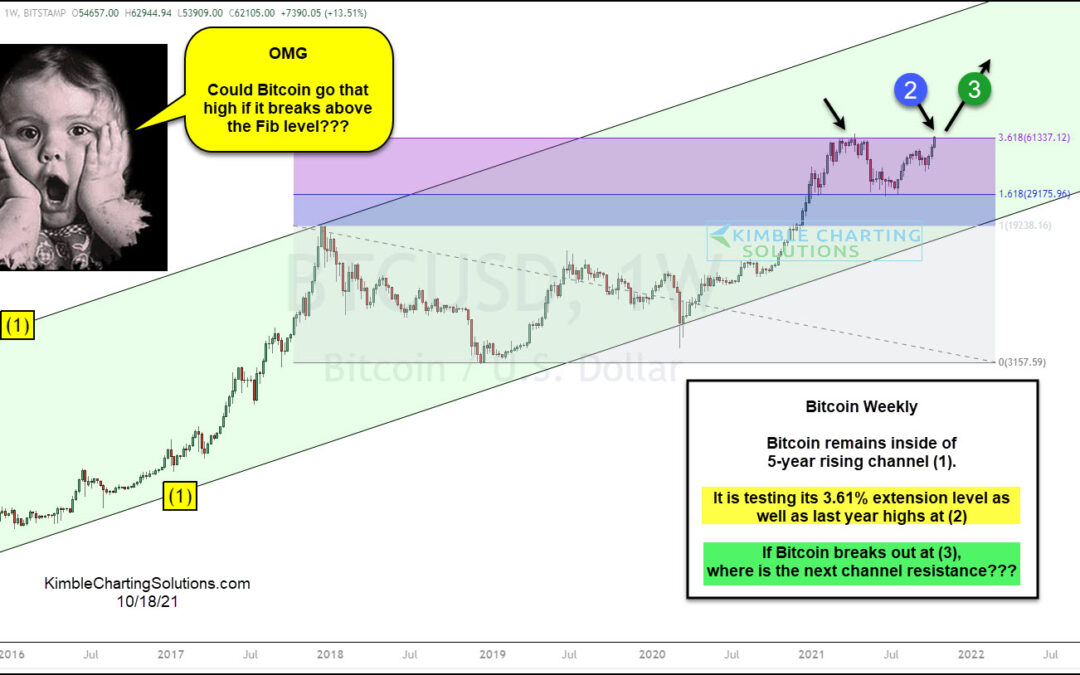
by Chris Kimble | Oct 18, 2021 | Kimble Charting
Can anything stop Bitcoin’s rising tide? We may know soon. Bitcoin’s recent run-up to over 60,000 is testing its 2020 highs and a key Fibonacci price resistance level. This area looks to be an important time/price juncture. Let’s dig in. Today’s chart is a “weekly”...
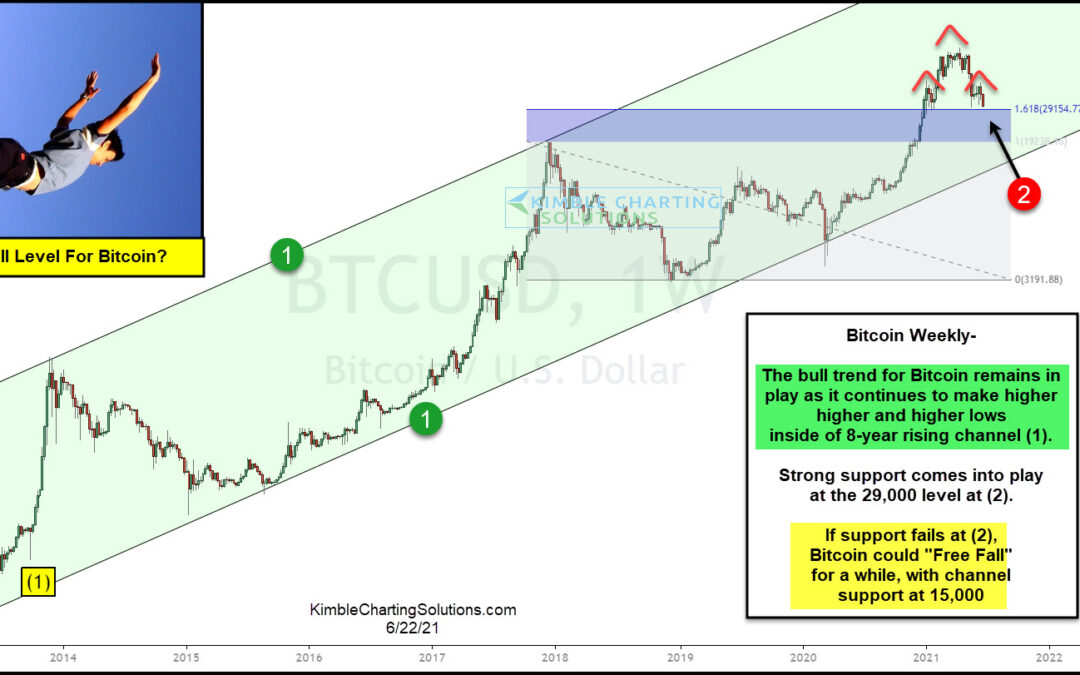
by Chris Kimble | Jun 22, 2021 | Kimble Charting
Could Bitcoin fall 50% and remain inside of a long-term bull channel/trend? Yes Bitcoin has created higher lows and higher highs over the past 8-years inside of the rising channel (1). Despite Bitcoin declining nearly 50% of late, it remains inside of this rising...
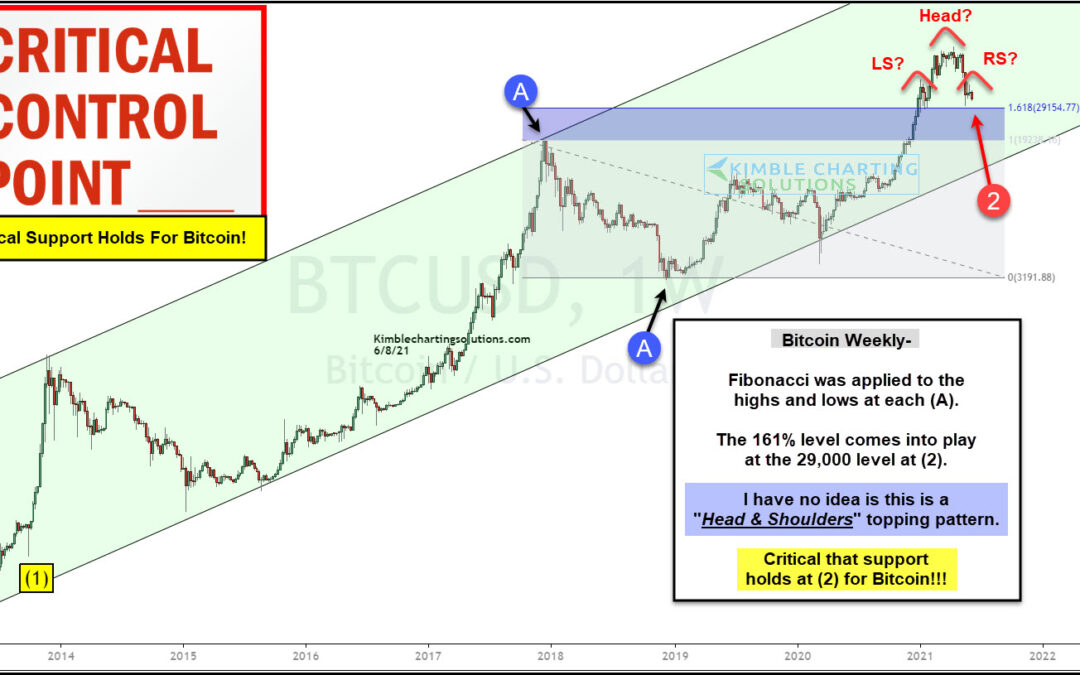
by Chris Kimble | Jun 10, 2021 | Kimble Charting
Last November, we highlighted a cup and handle bullish pattern on Bitcoin that served as a base for a big rally. All together, Bitcoin rallied from roughly $4,000 last March to $64,000 this April! Wowsers! BUT… since peaking in April, Bitcoin has fallen over 50% to...
