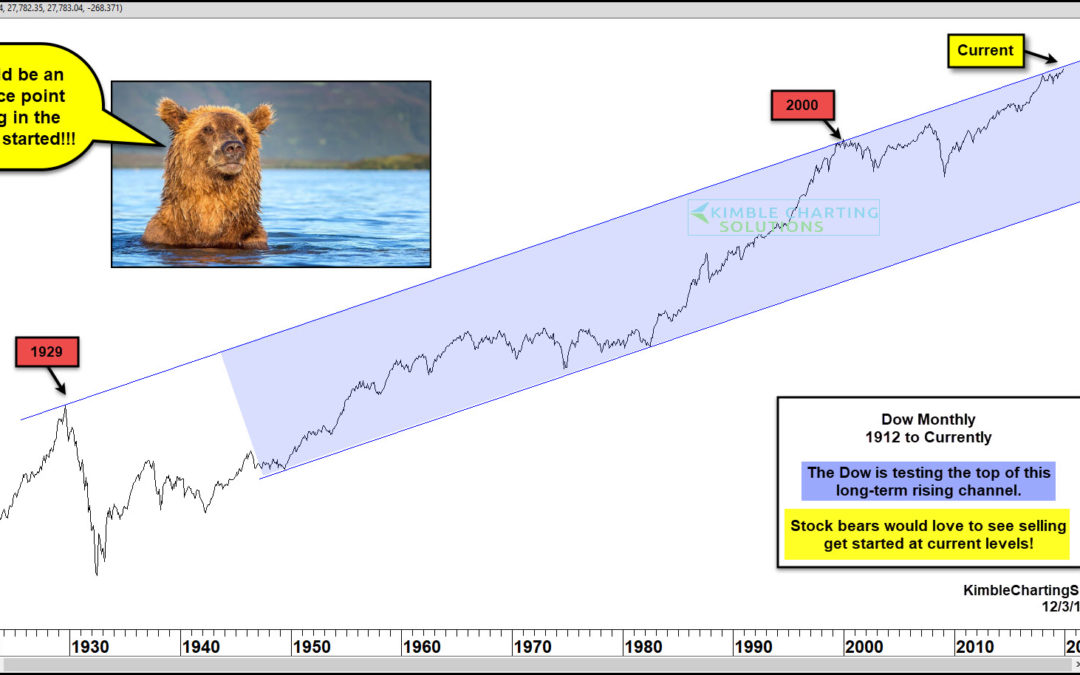
by Chris Kimble | Dec 3, 2019 | Kimble Charting
Is there an ideal price point that stock market bears would like to see the Dow peak? Yes and it could be at current levels! This chart looks at the Dow Jones Industrial Average over the past 100-years on a monthly basis. Since the late 1940s, the Dow has spent the...

by Chris Kimble | Aug 11, 2016 | Kimble Charting
The chart below looks at the Dow over the past 60-years, on a Monthly Closing basis. This chart updates the Mega Phone pattern the Dow seems to be forming over the past 20-years. CLICK ON CHART TO ENLARGE Dow broke above megaphone resistance and tested it a couple of...

by Chris Kimble | Jan 12, 2016 | Kimble Charting
CLICK ON CHART TO ENLARGE The Dow has made numerous important highs and lows along rising channel (A) over the past 70-years. The last two times channel line (A) was really important was at the 2002/03 lows and right before the big decline around the world in 2008....

by Chris Kimble | Sep 30, 2015 | Kimble Charting
Unless you live in a cave, your most likely well aware the stock markets around the world have been soft the past few months. The chart below looks at the Dow from a 50,000 foot view, going back to the 1920’s. CLICK ON CHART TO ENLARGE As you can see the Dow has...
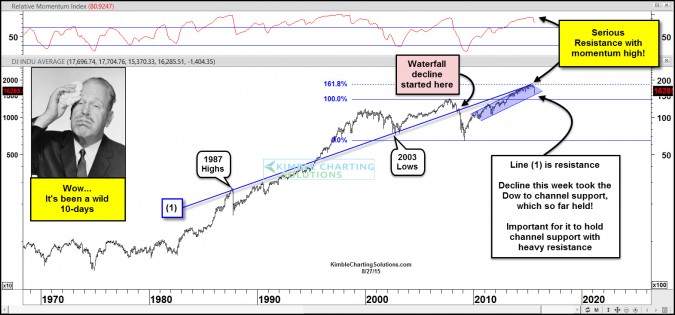
by Chris Kimble | Aug 27, 2015 | Global Dashboard, Kimble Charting
CLICK ON CHART TO ENLARGE If one takes the highs of 1987 and the lows of 2003 and ties them together and then projects a line into the future, you get line (1). The Dow hit line (1) and its Fibonacci 161% level in May and the Dow could make no more upward progress...

by Chris Kimble | Jun 25, 2015 | Global Dashboard, Kimble Charting
CLICK ON CHART TO ENLARGE This chart looks at the Dow over the past 115 years and no doubt the trend has been up since the 2009 lows and remains up! If one takes the 2007 monthly high and the 2009 monthly low and apply Fibonacci extension levels to those key highs and...

by Chris Kimble | Mar 27, 2015 | Kimble Charting
CLICK ON CHART TO ENLARGE Dow Jones Monthly has a unique long-term price test at hand right now. Its a combo of resistance tied to the 1987 highs and 2002 lows and Fibonacci extension tied to the 2007 highs and 2009 lows. Don’t see this combo to often. Gut says...

by Chris Kimble | Jan 30, 2015 | Kimble Charting
CLICK ON CHART TO ENLARGE This chart is the Dow “Quarterly” dating back to 1965. I applied Fibonacci to the Dow’s 2000 high and 2002 quarterly lows and then applied Fibonacci extension levels. The Dow stopped on a dime in 2007, as it hit the...
