
by Chris Kimble | Dec 19, 2017 | Kimble Charting
As the Dow is quickly approaching the 25,000 level, some might find it hard to remember that in the very near past, the Dow traded sideways for 21 months! Any reason the Dow didn’t make any progress for over a year and half? Could part of the reason be a key...
by Chris Kimble | Nov 22, 2017 | Kimble Charting
Below looks at the Dow Jones Industrials Index over the past 100 years on a monthly closing basis- In the early 1980’s the Dow used old resistance to become new support at (1), where a breakout and strong rallied followed. CLICK ON CHART TO ENLARGE The Dow looks...
by Chris Kimble | Nov 9, 2017 | Kimble Charting
How Europe and France’s stock markets perform can have a huge influence on stocks in the states. The first two charts below look at the FTSE 100 from London and the CAC 40 from France. CLICK ON CHART TO ENLARGE The FTSE Index trend remains up and no single day...

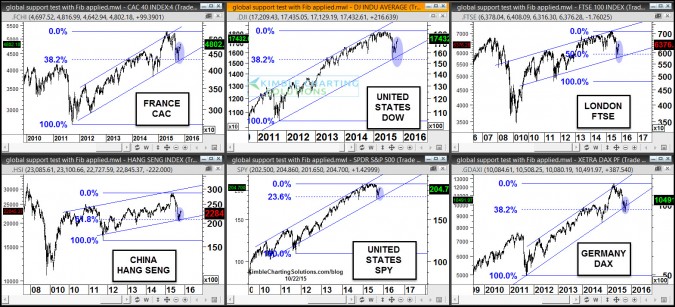
by Chris Kimble | Oct 29, 2015 | Global Dashboard, Kimble Charting
CLICK ON CHART TO ENLARGE Yesterday we conducted a webinar for our membership, in which we shared several positive stock seasonal studies. These studies reflected seasonal stock market strength takes place between now and the end of April next year. Historically it...
by Chris Kimble | Oct 22, 2015 | Kimble Charting
CLICK ON CHART TO ENLARGE Ryan Detrick, head of Statistical analysis for Kimble Charting Solutions and I were honored to be on a “Chart Art” panel this past week, at the Stocktoberfest meeting at Coronado Island. The main thrust of our talk was this;...

by Chris Kimble | Oct 14, 2015 | Global Dashboard, Kimble Charting
CLICK ON CHART TO ENLARGE The Dow formed what looks like a long-term “Megaphone” pattern in the late late 1960’s to early 1980’s. When it took out overhead resistance of the megaphone pattern in the mid 1980’s, it pretty much never looked...

by Chris Kimble | Oct 5, 2015 | Kimble Charting
A “Performance Indicator” with a very good track record, just sent an alert, for the first time since the 2000 highs. Good friend and market strategist Ryan Detrick and I will be discussing “Opportunities” that follow when our 125/5 Indicator...

by Chris Kimble | Sep 24, 2015 | Kimble Charting
In April 2014, I was honored to write a post for the “Market Masters” series right here on See It Market. In that post, I offered that investors could get a unique and valuable perspective on stocks and various markets by simply inverting their charts… And reduce...
