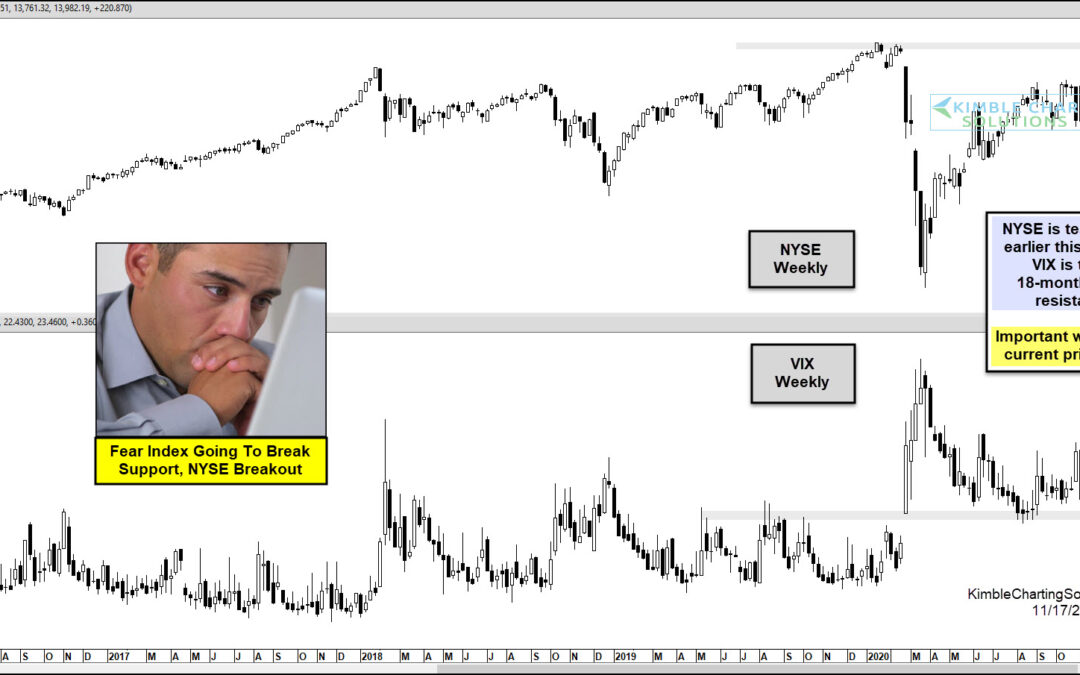
by Chris Kimble | Nov 17, 2020 | Kimble Charting
Is a key broad market index about to breakout? YES! With the trend being up for the NYSE index, a key breakout test is in play in the top half of the chart above. At the same time, the fear index (VIX) is testing a support & resistance line, that has been in play...

by Chris Kimble | May 10, 2017 | Kimble Charting
Below looks at the VIX index over the past decade. Over the past three weeks, the VIX has been falling sharply, over 40%. This decline has our attention from a Power of the Pattern perspective, see why below. CLICK ON CHART TO ENLARGE Over the past 7-years, the VIX...

by Chris Kimble | May 9, 2017 | Kimble Charting
Three weeks ago yesterday, the Fear Index (VIX), was pushing sharply higher, on a very small decline in the S&P 500. When this happened, the Power of the Pattern was suggest to go against the crowd. Below looks at the VIX index over the past 10-years. CLICK ON...

by Chris Kimble | Feb 28, 2017 | Kimble Charting
Some times a “Kiss Of Resistance” can take place at a price level, that can be dangerous for the current trend. Could Crude Oil be kissing resistance, at a dangerous price point, that could impact the current up trend? Below looks at a chart of Crude Oil...

by Chris Kimble | Feb 17, 2017 | Kimble Charting
Markets have been on a steady rise and the same can be said for Inverse Fear ETF (XIV). Below looks at Inverse Fear ETF (XIV) since the lows in 2011. CLICK ON CHART TO ENLARGE What a difference a year can make! One year ago this week, XIV was testing rising channel...

by Chris Kimble | Apr 1, 2016 | Kimble Charting
CNBC shared the stat below this morning, per the Dow just experienced the “biggest comeback since 1933.” CLICK ON CHART TO ENLARGE Does a “comeback” mean money was made for the buy and hold community? Even though the comeback was historic, the...

by Chris Kimble | Aug 25, 2015 | Kimble Charting
CLICK ON CHART TO ENLARGE Did investors get ahead of themselves the past couple of days? From a fear perspective, it looks like they might have! This chart looks at the Fear Index (VIX) over the past 25-years. As you can see, the VIX has only reached the 48 level, 8...
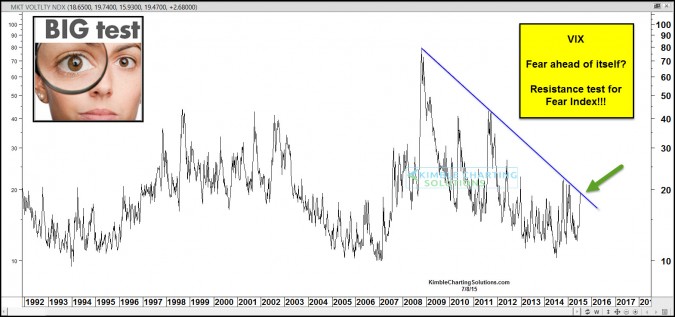
by Chris Kimble | Jul 9, 2015 | Kimble Charting
CLICK ON CHART TO ENLARGE The VIX (Fear Index) has shot up of late on a very small decline in the S&P 500. Did it get ahead of itself? A small decline in the S&P 500 has the VIX hitting resistance based upon the 2009 highs. For the past few years fear has...
