
by Chris Kimble | Oct 1, 2014 | Kimble Charting
CLICK ON CHART TO ENLARGE The U.S. Dollar just had its 6th best quarterly rally in the past 34 years, see upper left table. (Source Ryan Detrick) This rally has taken the U.S. Dollar to the top of a channel that that has been in place for the past 10 years and...

by Chris Kimble | Sep 5, 2014 | Kimble Charting
CLICK ON CHART TO ENLARGE When it comes to poor performance over the last couple of years, Wheat sure comes to mind! The lower section of the chart above is the 2-year rate of change (ROC) applied to Wheat. As you can see the ROC has been this low only a few...
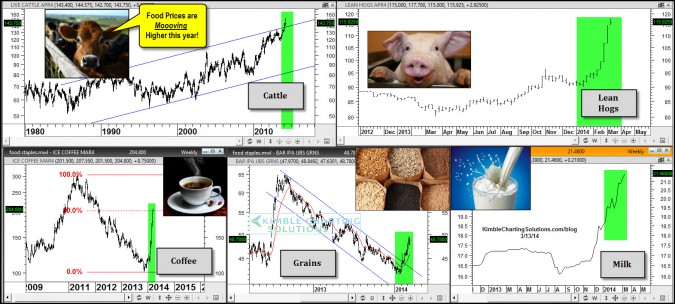
by Chris Kimble | Mar 13, 2014 | Kimble Charting
CLICK ON CHART TO ENLARGE Looks like a trip to the grocery store will be a more expensive endeavor in the near future as Beef, Hogs, Coffee, Grains and Milk are rapidly moving higher since the start of this year. Is the weather to blame for higher prices?...

by Chris Kimble | Mar 3, 2014 | Kimble Charting
CLICK ON CHART TO ENLARGE Commodities have had a rough few years and key grains, (Wheat, Corn & Soybeans) went along for the ride, to the downside. I believe in the ole idea of buy low and sell higher and this complex has been of interest to me since the...

by Chris Kimble | Jan 15, 2014 | Kimble Charting, Sector / Commodity
CLICK ON CHART TO ENLARGE Ever heard of the idea of buy low & sell higher? Believe in it? If not quit reading now! If you do believe in the idea of buy low & sell higher or believe in buying assets that are out of favor, the above chart might be of...
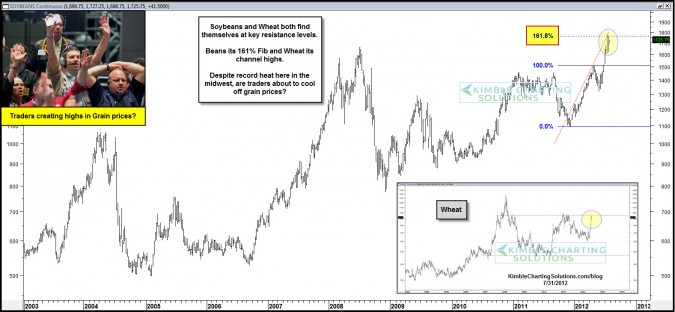
by Chris Kimble | Jul 31, 2012 | Kimble Charting
CLICK ON CHART TO ENLARGE Wheat and Soybean prices are up 30% in the past few months, reflecting the extreme drought conditions. The Power of the Pattern highlighted breakouts earlier this month (see grain breakouts) Now Beans are up against a 161% Fibonacci extension...

by Chris Kimble | Jul 13, 2012 | Kimble Charting
Inflation? Deflation? Or some of both…. “Bi-Flation” CLICK ON CHART TO ENLARGE A breakout in grains, could cause inflation in certain parts of our economy to scream higher! The broad based MS Commodity Index (CRX) finds itself on a...

by Chris Kimble | Jul 5, 2012 | Kimble Charting
On 6/27 the Power of the Pattern reflected that Commodity ETF JJA, could match the weather and become a hot performer on a resistance line breakout. (see post here) Since pushing above this line, JJA has gained more than 6% in 4 days. CLICK ON CHART...
