
by Chris Kimble | Jan 29, 2016 | Kimble Charting
CLICK ON CHART TO ENLARGE Today is the last day of the first month of the year. I favor monthly charts over weekly and weekly charts over daily. Wanted to take a long-term view of the Nasdaq 100 on a monthly basis on this last Friday of the month. As you can see, the...

by Chris Kimble | Jan 4, 2016 | Kimble Charting
CLICK ON CHART TO ENLARGE The rally over the past few years has taken the Nasdaq 100 back to levels last seen at the heights of the Dot.com bubble in 2000. At the same time the NDX 100 is hitting its 2000 highs, monthly momentum is hitting levels last seen in 2000....
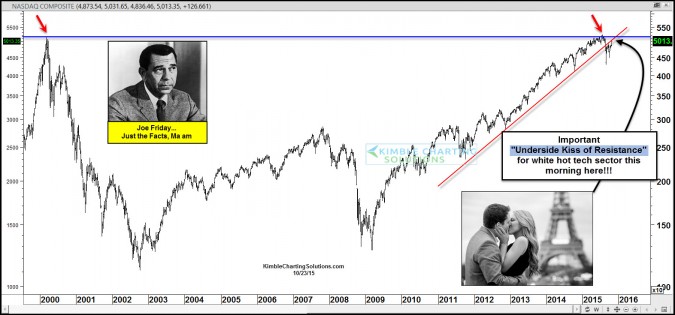
by Chris Kimble | Oct 23, 2015 | Kimble Charting
CLICK ON CHART TO ENLARGE Good earnings in tech land causing some tech companies to scream higher this morning. If one owned Google, Amazon or Microsoft at yesterdays close, they are doing well this morning. The rallies in tech land has the Nasdaq Composite index at...

by Chris Kimble | Oct 5, 2015 | Kimble Charting
A “Performance Indicator” with a very good track record, just sent an alert, for the first time since the 2000 highs. Good friend and market strategist Ryan Detrick and I will be discussing “Opportunities” that follow when our 125/5 Indicator...

by Chris Kimble | Sep 28, 2015 | Global Dashboard, Kimble Charting
CLICK ON CHART TO ENLARGE The Nasdaq 100 index has remained inside of this rising channel for the past 5-years. The herd continues to buy the dip along support of this rising channel. Last week the NDX 100 close a couple of percent lower on the week and it closed very...

by Chris Kimble | Sep 24, 2015 | Kimble Charting
In April 2014, I was honored to write a post for the “Market Masters” series right here on See It Market. In that post, I offered that investors could get a unique and valuable perspective on stocks and various markets by simply inverting their charts… And reduce...

by Chris Kimble | Aug 21, 2015 | Kimble Charting
CLICK ON CHART TO ENLARGE This chart looks at the Nasdaq Composite Index, dating back almost 25-years. The strong rally in this tech index off the double bottom in 2009 has been very impressive, as tech has been stronger than the broad market. The rally now has the...

by Chris Kimble | Aug 14, 2015 | Kimble Charting
Let me start off with this…At this time the trend in the tech space is up! The Nasdaq Composite Index and Nasdaq 100 are both above support lines and long-term moving averages! Leading tech indices are at prices points where weakness would not be good to see...
