
by Chris Kimble | Dec 10, 2013 | Kimble Charting
CLICK ON CHART TO ENLARGE If one has invested in the Thompson Reuters/Jefferies CRB Commodities index since 2011, its not been a fun ride as the index is down 25% over the past couple of years and has made a series of lower highs. On the opposite side over the past 18...

by Chris Kimble | Dec 5, 2013 | Kimble Charting
CLICK ON CHART TO ENLARGE Natural Gas created bullish wicks at rising channel support & key Fibonacci levels at (1) in the chart above, both were positive and bullish. At (2) NG breaks from its falling channel resistance at (2). Premium Members had standing ...
by Chris Kimble | Oct 10, 2013 | Kimble Charting
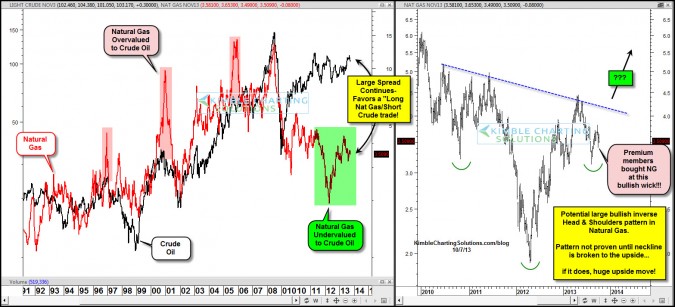
CLICK ON CHART TO ENLARGE The left chart is a overlay between Crude Oil and Natural Gas over the past 20 years. Some times one product outperforms another and creates “large spreads” which in time will narrow. Since 2010 the spread between Crude/Natural...

by Chris Kimble | Oct 1, 2013 | Kimble Charting
CLICK ON CHART TO ENLARGE A month ago the Power of the Pattern suggested to Premium members to “Short Crude Oil” (left chart) due to channel resistance and overbought momentum, despite the potential conflict in Syria! DTO (short Crude ETF) Last...

by Chris Kimble | Sep 3, 2013 | Kimble Charting, Sector / Commodity
CLICK ON CHART TO ENLARGE Natural Gas ETF (UNG) fell 30% from it April highs to its early August lows, as it hit the bottom of of the falling channel above. Now UNG is breaking above resistance of the falling channel above. Since August the 7th, the inset chart...

by Chris Kimble | Aug 3, 2013 | Kimble Charting
CLICK ON CHART TO ENLARGE Natural Gas ETF (UNG) fell 30% from it April highs to its early August lows, as it hit the bottom of of the falling channel above. Now UNG is breaking above resistance of the falling channel above. Since August the 7th, the inset chart...
by Chris Kimble | May 9, 2013 | Kimble Charting
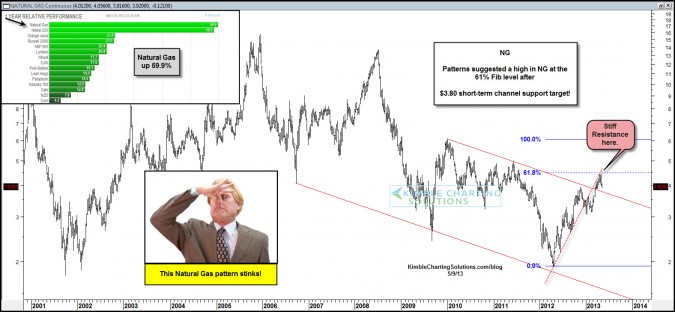
CLICK ON CHART TO ENLARGE Natural Gas is up 59% over the past year. Shared two days ago that NG was at resistance and could have formed a Double top (see stocktwits chart here) at its 61% Fibonacci resistance level. See next short-term support above… –...
by Chris Kimble | May 2, 2013 | Kimble Charting
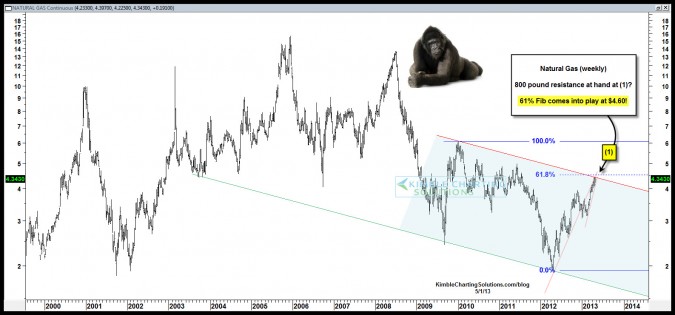
CLICK ON CHART TO ENLARGE Shared the above chart on Stocktwits yesterday (see post here) Natural Gas is facing channel resistance at its 61% Fibonacci ratio. See what Natural Gas is doing today? (get quote here). The ole 800 pound guys is doing his thing! Follow...
