
by Chris Kimble | Aug 1, 2017 | Kimble Charting
Crude Oil is worth about a third (down 65%) of what it was worth back in 2008. It’s lost about half of it value from just three years ago (2014 highs). The declines in Crude over the past 9-years has created a series of lower highs, reflecting it still remains...

by Chris Kimble | Feb 24, 2017 | Kimble Charting
Below takes a look at the price action of Crude Oil, Energy ETF (XLE) and Oil & Gas Exploration ETF (XOP) over the past three years. Could Energy stocks be suggesting the next big move in Crude Oil again? Which direction are they suggesting? CLICK ON CHART TO...

by Chris Kimble | Feb 7, 2017 | Kimble Charting
In the summer of 2014, when Crude Oil was trading near $106 per barrel, traders amassed the largest bullish crowded trade in history. After the crowd turned big time bullish Crude Oil, it started falling in price and Crude underwent a history decline, losing over...

by Chris Kimble | Feb 9, 2015 | Kimble Charting
CLICK ON CHART TO ENLARGE No doubt the oil patch has been hit hard of late and Transocean (RIG) hasn’t escaped the downtrend. Conditions in RIG, 80%+ decline since 2008, at falling channel support, momentum very low and a bullish falling wedge had...

by Chris Kimble | Jul 15, 2014 | Kimble Charting
CLICK ON CHART TO ENLARGE Even though the media tells us of some unrest in the mid-east, Crude Oil is breaking support of a bearish rising wedge of late! On June 20th, Crude oil hit a short-term high on news coming out of Iraq and since then Crude Oil is down...

by Chris Kimble | Jul 7, 2014 | Kimble Charting
CLICK ON CHART TO ENLARGE Unrest in Iraq pushed Crude Oil prices up for a week and bullish sentiment towards crude reached lofty levels. Turmoil continues in Iraq, yet Crude Oil turned soft. The decline in crude oil has it now testing a 6-month support line and...
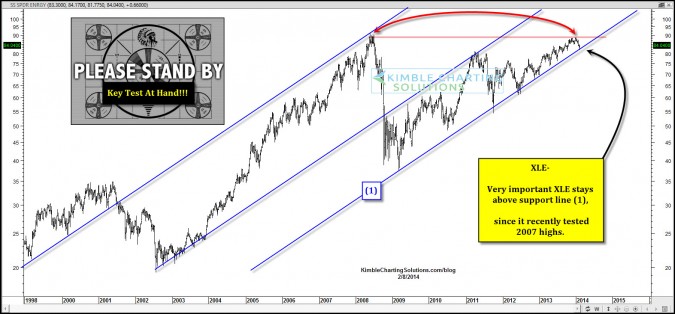
by Chris Kimble | Feb 11, 2014 | Kimble Charting
CLICK ON CHART TO ENLARGE The Dow and S&P 500 are near all-time highs, energy stocks are attempting to join them. Energy ETF (XLE) recently hit its 2007 highs and backed off a little. The decline now has XLE testing support of this 6-year rising...

by Chris Kimble | Jan 15, 2014 | Kimble Charting, Sector / Commodity
CLICK ON CHART TO ENLARGE Ever heard of the idea of buy low & sell higher? Believe in it? If not quit reading now! If you do believe in the idea of buy low & sell higher or believe in buying assets that are out of favor, the above chart might be of...
