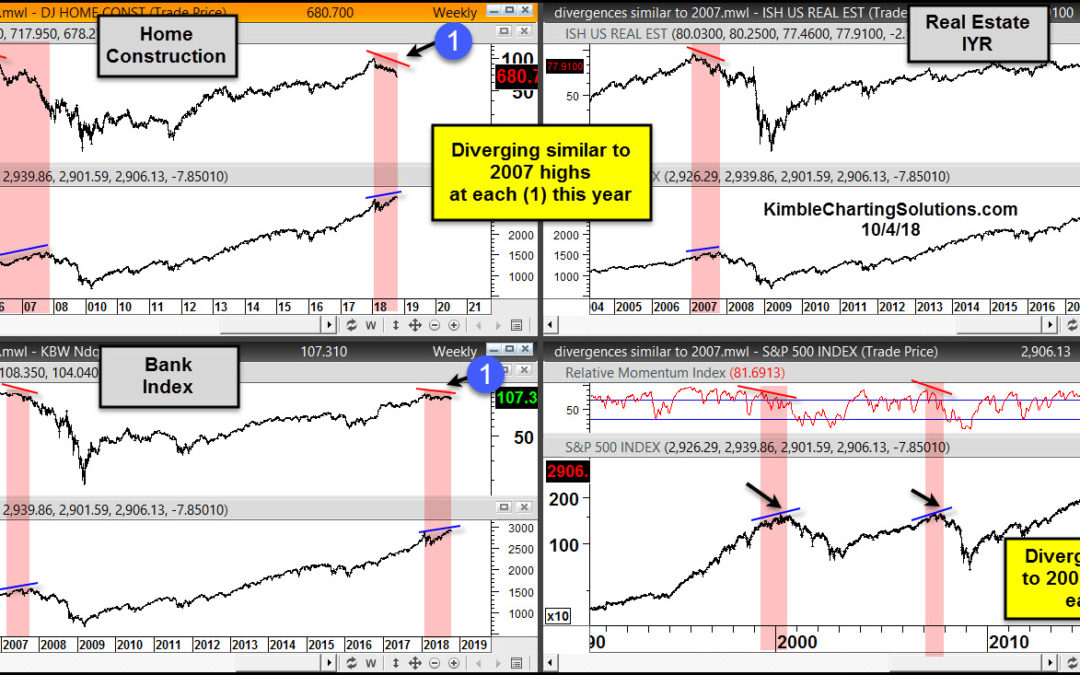
by Chris Kimble | Oct 6, 2018 | Kimble Charting
We did an earlier chart reflecting that home builders are diverging similar to 2007. Housing is a critical component to the economy and stock market, as we found out a decade ago. And unfortunately, current housing market concerns don’t end there. There are several...

by Chris Kimble | Feb 24, 2018 | Kimble Charting
One of Mark Twain’s famous quotes is “The reports of my death have been greatly exaggerated.” It’s very easy to find people saying the death of the 25-year bond market has already taken place. Has the death of the bond bull actually happened?...

by Chris Kimble | Feb 13, 2018 | Kimble Charting
Some of our Financial Planning/RIA customers ask us to send them long-term moving averages on a weekly basis, because it helps them make long-term asset allocation decisions. This 6-pack was created to give perspective on a diverse set of assets. It includes...

by Chris Kimble | Feb 10, 2018 | Kimble Charting
Market declines and under performance can create opportunities. The table below looks at performance of the S&P 500 sectors over the past 90-days. As you can see the S&P has pretty much went nowhere, yet two different sectors have been hit hard! CLICK ON CHART...

by Chris Kimble | Mar 15, 2017 | Kimble Charting
Below compares the performance of the S&P 500 and Real Estate ETF (IYR) over the past 10-years. Since the highs in 2007, IYR has little to brag about as it’s net asset value has declined 10%. The S&P during this same time frame is up 66%. CLICK ON CHART...

by Chris Kimble | Nov 22, 2016 | Kimble Charting
Rate sensitive assets have experienced rare moves since July. Government bonds (TLT), Utilities (XLU) and Real Estate (IYR) have fallen hard, as interest rates have risen of sharply. Have rates hit a peak or are they just getting started, on a much greater move much...

by Chris Kimble | Feb 7, 2015 | Kimble Charting
CLICK ON CHART TO ENLARGE Interest rate sensitive assets like Government bonds (TLT), Real Estate (IYR) and Utilities (XLU) have benefit greatly from falling rates and the macro theme of deflation, pushing all of them much higher over the past year(s). Over the...
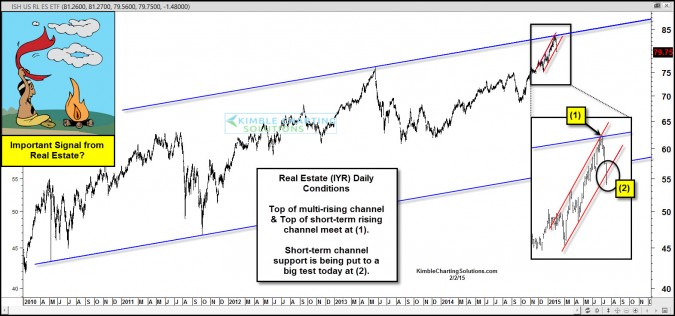
by Chris Kimble | Feb 2, 2015 | Kimble Charting
CLICK ON CHART TO ENLARGE Real Estate ETF (IYR) has done very well over the past year, gaining almost 10% more than SPY. Going into today, IYR was around 6% ahead of SPY YTD. The Power of the Pattern reflects that IYR is at the top of a long-term trend channel...
