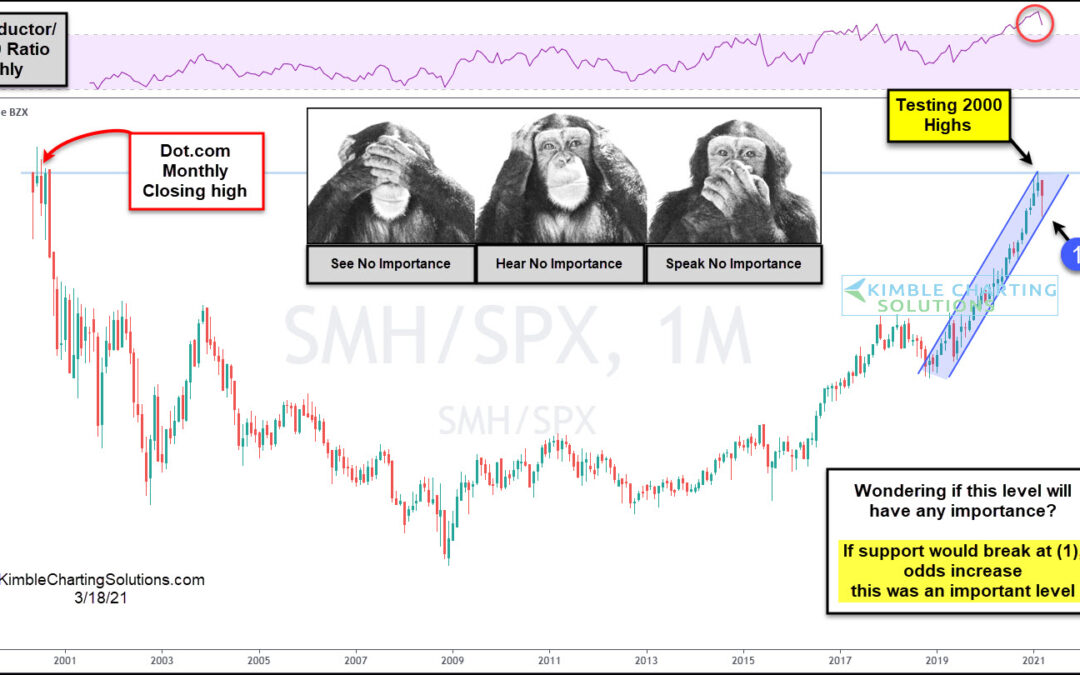
by Chris Kimble | Mar 18, 2021 | Kimble Charting
Are tech stocks hitting a long-term level that could become historically important? Possible! This chart looks at the Semiconductor/S&P 500 ratio, on a monthly basis, over the past 20-years. The ratio peaked and rolled over in 2000, sending a bearish message to...
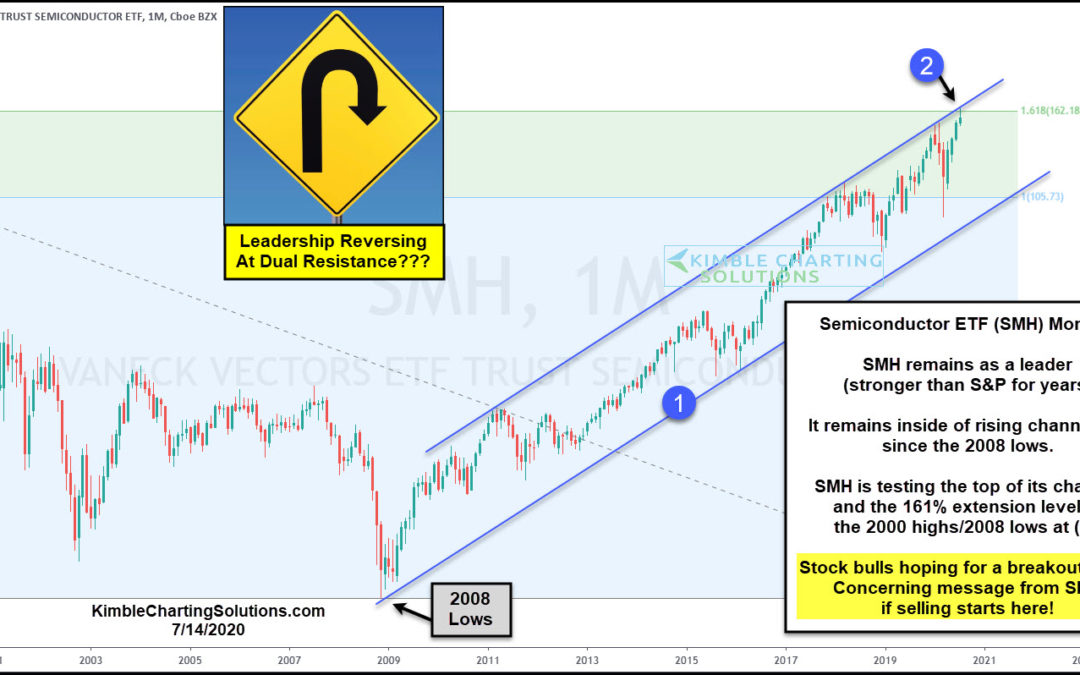
by Chris Kimble | Jul 14, 2020 | Kimble Charting
Is leadership running into a brick wall of resistance and about to pull an important reversal? A strong bullish trend looks to be experiencing an important breakout test! The trend for SMH remains up as it has spent the past 10-years inside of rising channel (1). This...
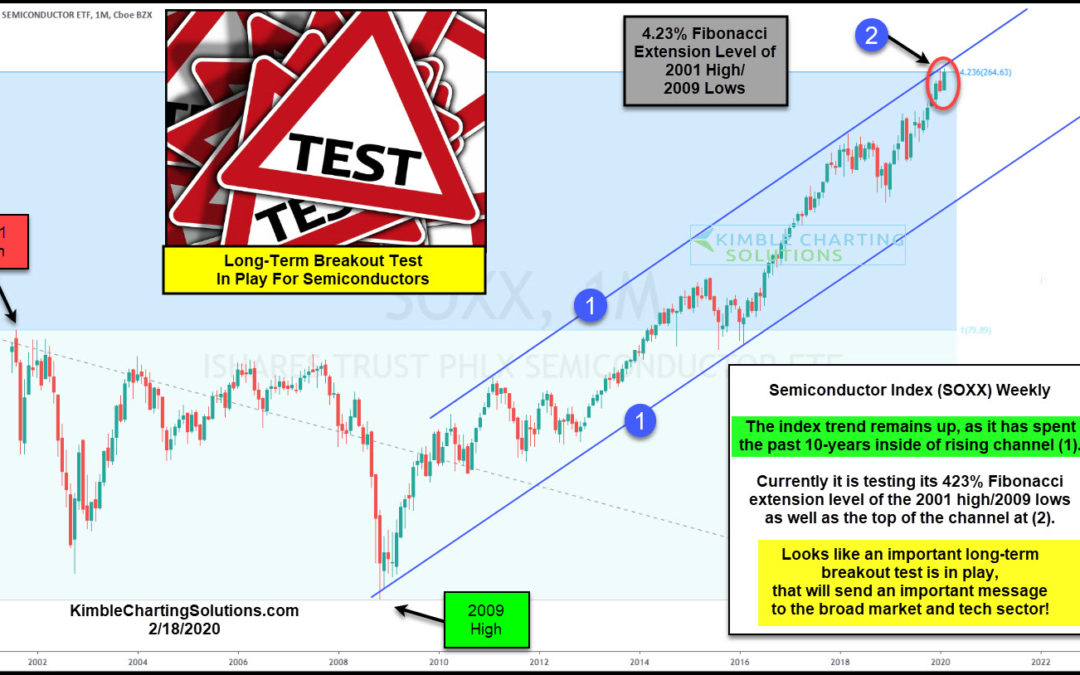
by Chris Kimble | Feb 18, 2020 | Kimble Charting
Since the 2009 lows, Semiconductors have been taken a leadership role as they have far outpaced the gains of the S&P 500. Gains since the 2009 lows; SOXX Index = +821% S&P 500 = +273%. The SOXX index has spent the majority of the past 10-years inside of rising...
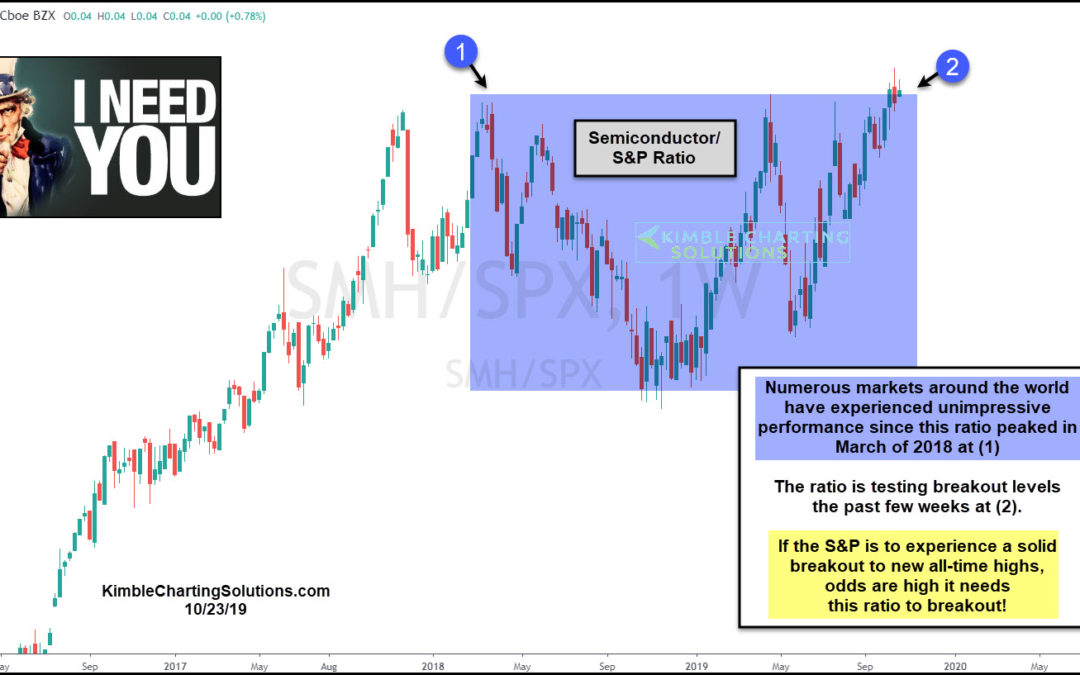
by Chris Kimble | Oct 23, 2019 | Kimble Charting
Is a leading Tech sector about to send the broad market a key message? In our opinion, yes! This chart looks at the Semiconductor/S&P ratio over the past couple of years. When the ratio peaked around March of last year at (1), numerous indices in the states (NYSE,...
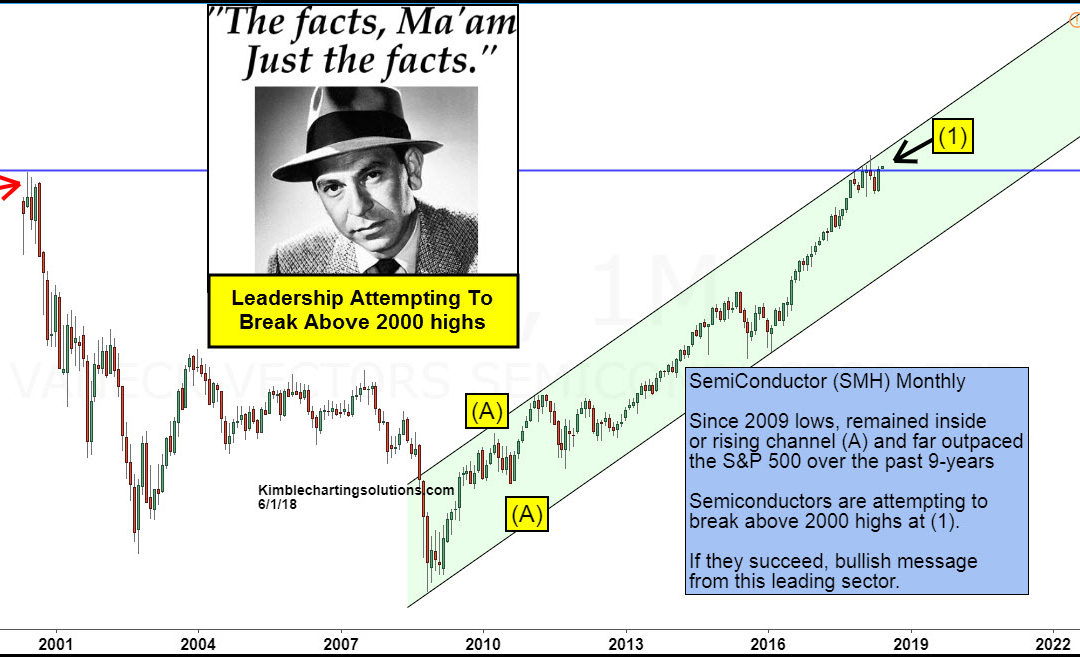
by Chris Kimble | Jun 1, 2018 | Kimble Charting
CLICK ON CHART TO ENLARGE Since the lows in 2009, Semiconductors (SMH) have far out paced the S&P 500 to the upside. Since the lows in 2009, SMH has spent the majority of the past 9-years inside of rising channel (A). This rally now has SMH back at the highs it...
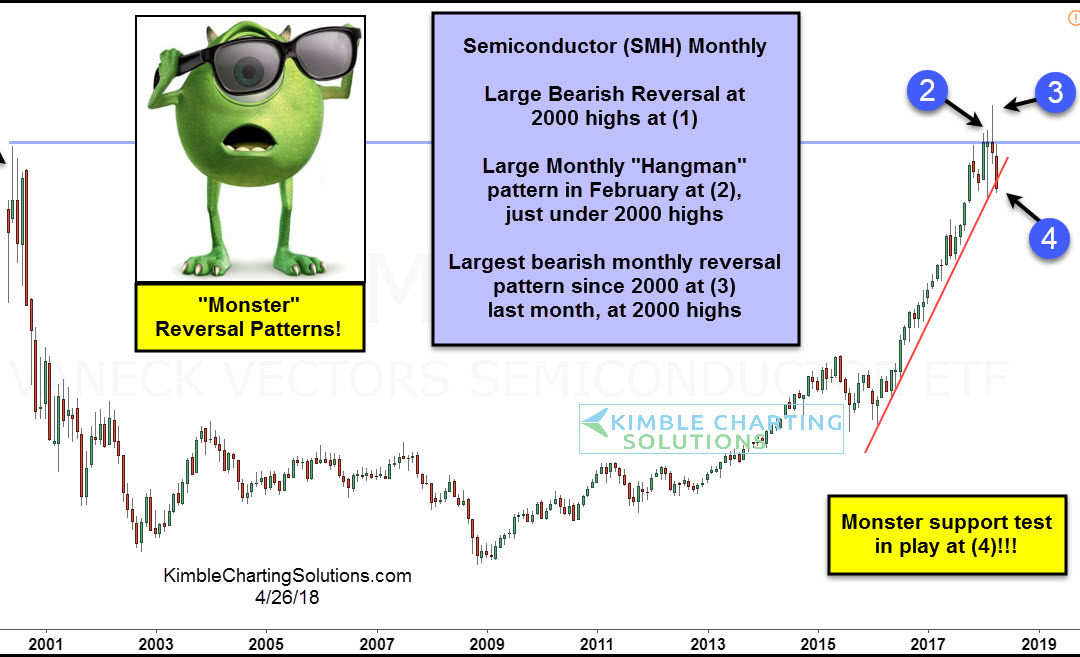
by Chris Kimble | Apr 26, 2018 | Kimble Charting
CLICK ON CHART TO ENLARGE Semiconductor ETF (SMH) has been much stronger than the broad market since the 2009 low, almost doubling the gains of the S&P 500 in the past 9-years. The long-term trend on this leading index remains up at the time. The near vertical...

by Chris Kimble | Jan 30, 2018 | Kimble Charting
Banks started showing cracks back in 2007 and before long they started breaking support and fell hard. The current bank trend remains UP at this time. The trend finds itself back at 2007 highs, where bulls would NOT want to see selling pressure start taking place!...
by Chris Kimble | Dec 13, 2017 | Kimble Charting
Since the 2009 stock market lows, investors have looked to the Semiconductor sector for strong returns and market leadership. Just check out the performance numbers vs the broader stock market: Semiconductor ETF (SMH) +494% vs S&P 500 +262%. With numbers that...
