by Chris Kimble | Oct 30, 2020 | Kimble Charting
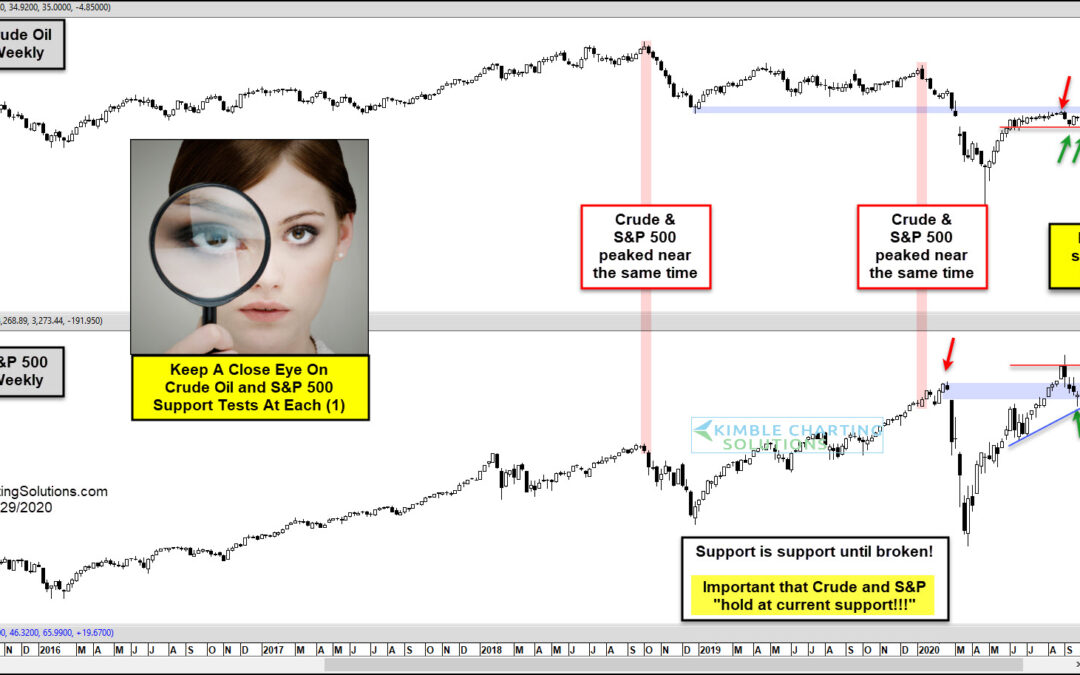
The price of crude oil has been an important indicator of the economy for quite some time. When oil is in demand and performing well, the economy likely is. And when oil is not performing well, the economy likely isn’t either. Taking this one step further, it’s easy...
by Chris Kimble | Oct 28, 2020 | Kimble Charting
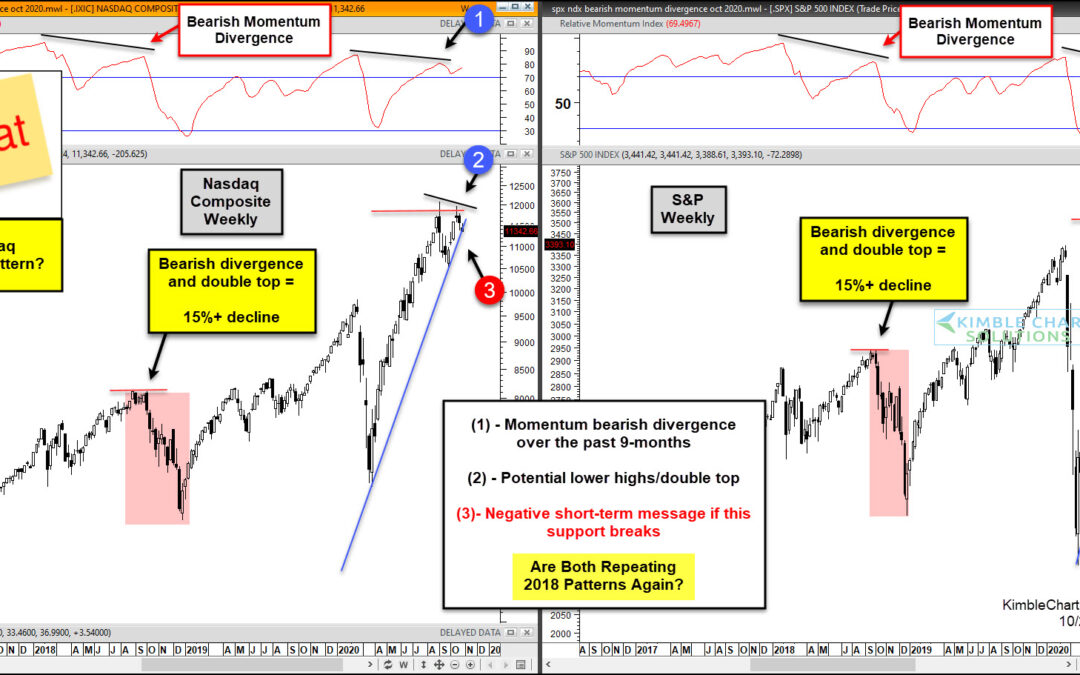
Stock market volatility has turned higher as the month of October has wore on. And now that we are just one week away from the elections, it appears that investors are showing their uncertainty through the price action on the major U.S. stock market indices. In...
by Chris Kimble | Aug 26, 2020 | Kimble Charting
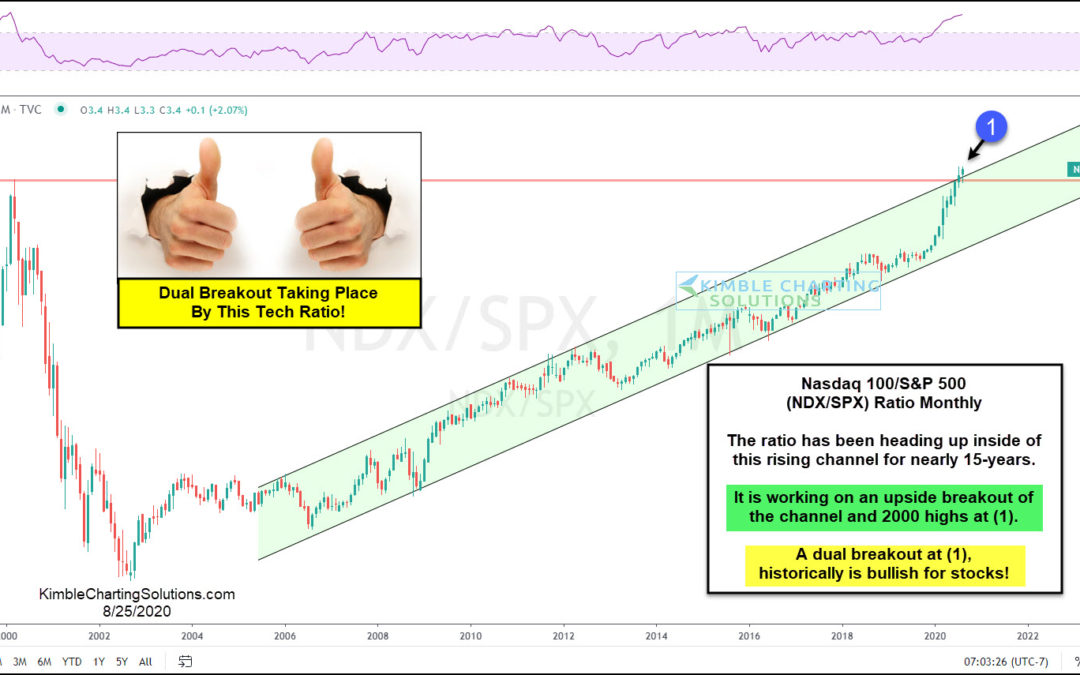
This year has definitely accelerated the trend in utilizing technology in the way we work (remotely) and live. And it’s showing up in the stock market. Today’s chart looks at the ratio of the Nasdaq 100 Index (large-cap tech stocks) to the S&P 500 Index...
by Chris Kimble | Aug 17, 2020 | Kimble Charting
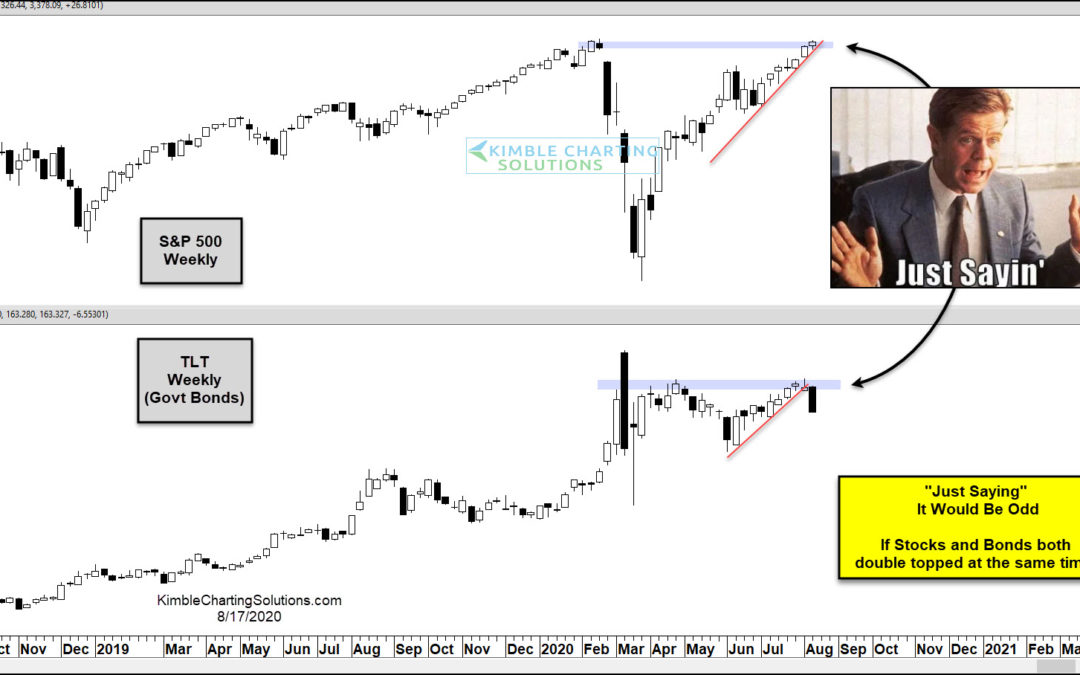
Its been an interesting year in the financial markets, to say the least. And today’s chart qualifies as “interesting” indeed. When the market crashed in March, bond prices surged as yields fell. And the 20+ Year US Treasury Bond ETF (TLT) hit $179 before reversing...
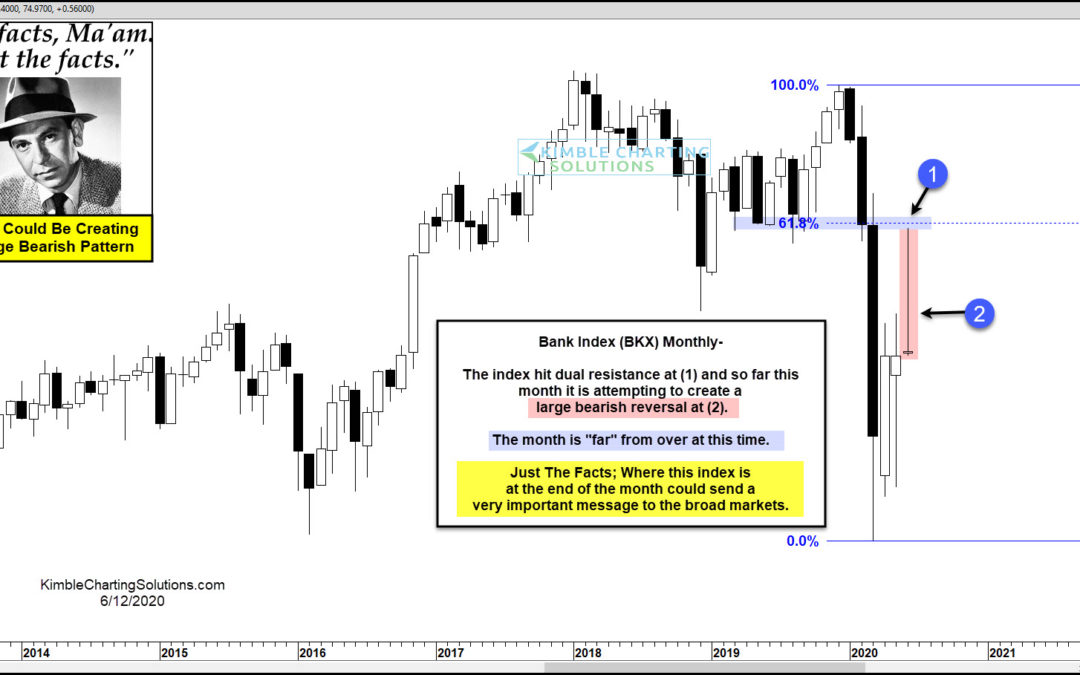
by Chris Kimble | Jun 12, 2020 | Kimble Charting
Are Banks going to end the month with a large bearish pattern just below dual resistance? Possible, yet the month is far from over! This chart looks at the Bank Index (BKX) on a monthly basis. The rally this month took it up to test its 61% retracement level and old...
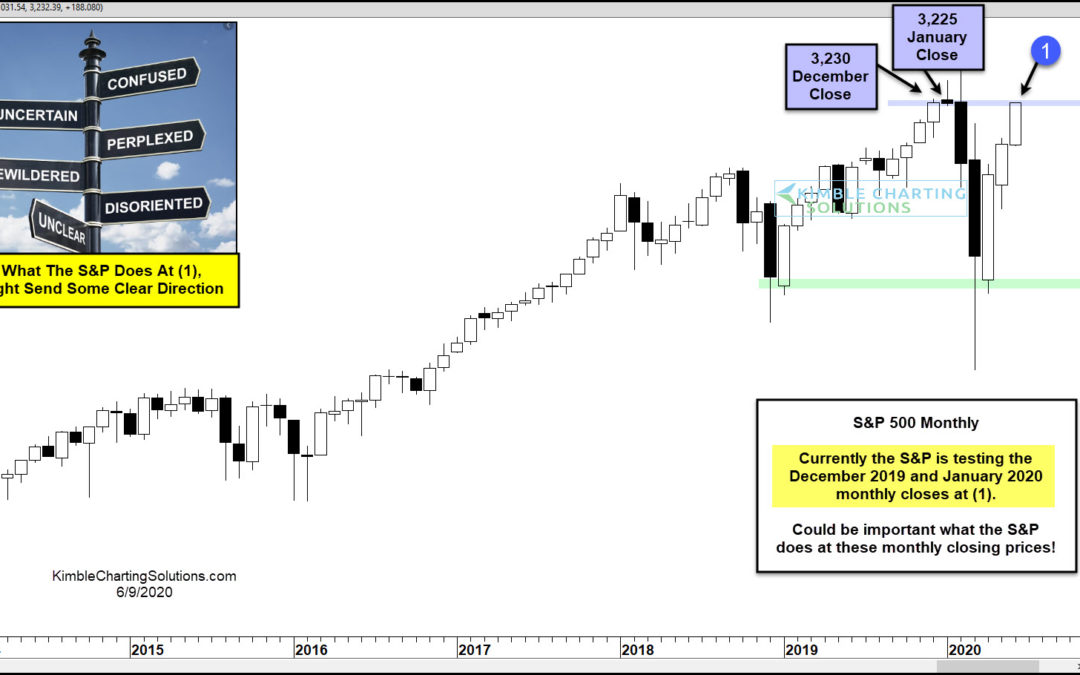
by Chris Kimble | Jun 10, 2020 | Kimble Charting
The stock market rally has taken the S&P 500 Index all the way back to an important price point on the “monthly” chart. And how the index closes during the summer months may provide further direction to investors, starting with June. As you can see in today’s...
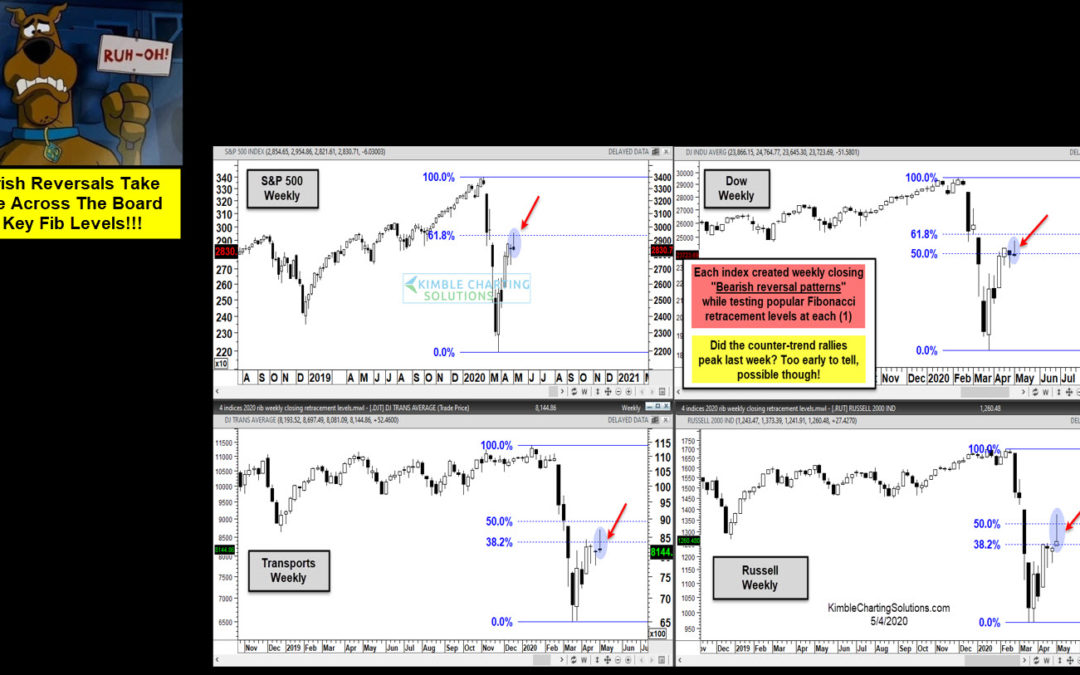
by Chris Kimble | May 4, 2020 | Kimble Charting
Is it Ruh-Roh Time for stock market bulls? Possible!!! Stock market bulls might have received a very concerning message last week from numerous indices! This 4-pack reflects that each popular index created a sizeable bearish reversal pattern at respective Fibonacci...
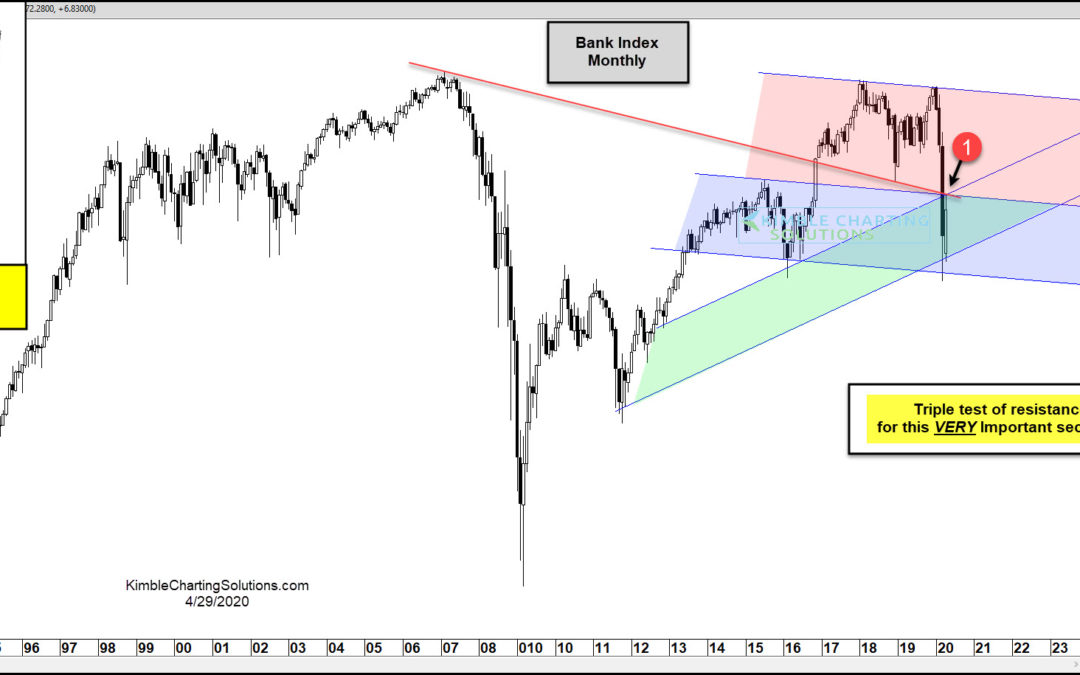
by Chris Kimble | Apr 29, 2020 | Kimble Charting
A healthy banking system is the hallmark of a growing economy. So when back stocks turn “south”, investors should tune in. Like the broader stock market indices, the Bank Index (BKX) crashed in March before bouncing back into April. That bounce has the Bank Index...
