by Chris Kimble | Apr 20, 2020 | Kimble Charting
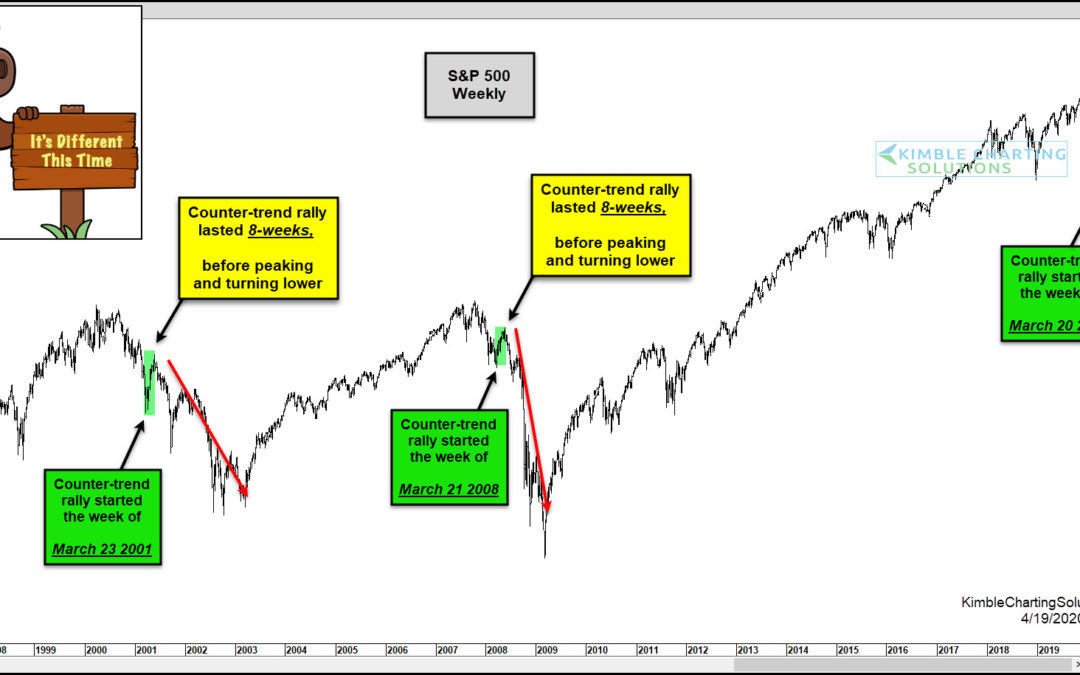
Does history repeat exactly? No. Sometimes it rhymes big-times!!! This chart looks at the S&P 500 over the past 25-years on a weekly basis. During the 50% bear markets of 2000-2003 and 2007-2009, the S&P started quality counter-trend rallies very near the...

by Chris Kimble | Apr 17, 2020 | Kimble Charting
Is our banking system about to send us one of the most important messages in the last two decades? Joe Friday says,”Absolutely yes!!!” The top chart looks at the Banking index (BKX) over the past 25-years. The 60-65 price zone is represented by line (1)....
by Chris Kimble | Apr 15, 2020 | Kimble Charting
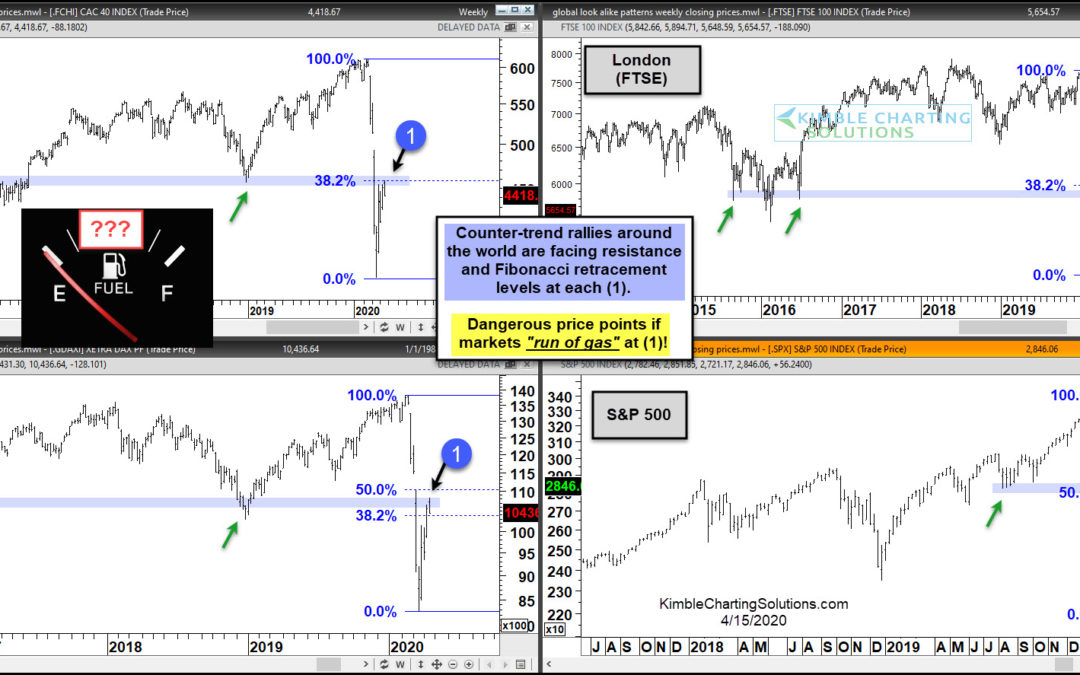
What goes up in a down market? Correlation! This 4-pack looks at patterns of Germany, London, France, and the States. No doubt each has been hit hard in the first quarter of 2020. All four have experienced counter-trend rallies, where each is facing multi-year...
by Chris Kimble | Apr 8, 2020 | Kimble Charting
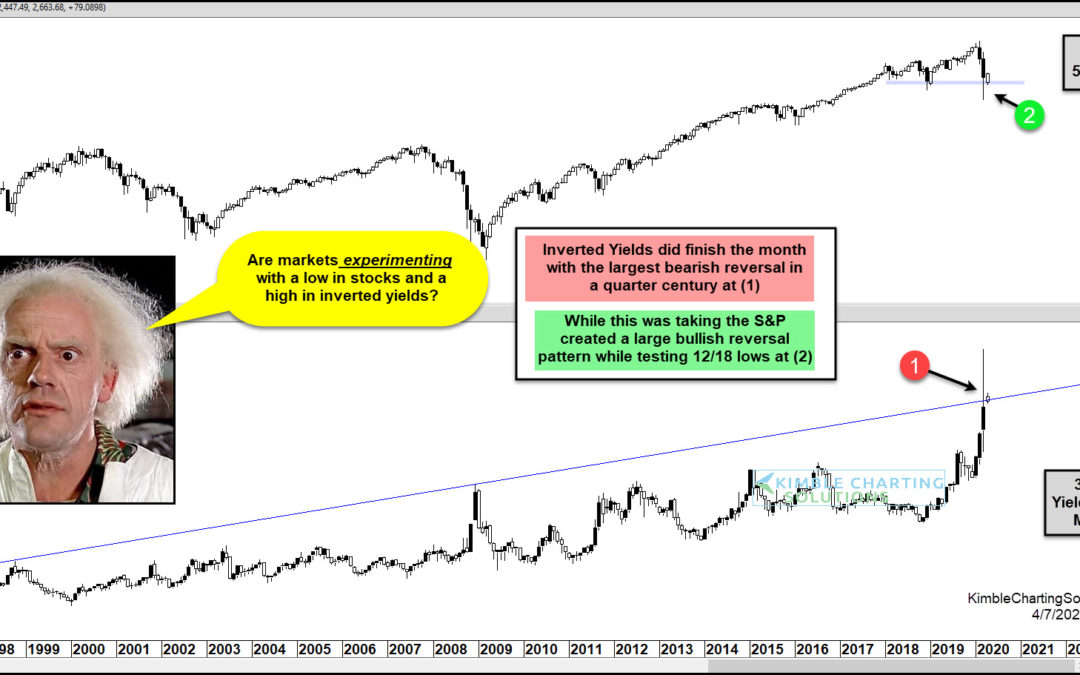
S&P 500 Index versus “Inverted” 30 Year Yield “monthly” Chart Stocks and treasury bond yields had a wild (and scary) month of March as the financial markets crashed to new lows. In today’s chart, we highlight this by looking at long-term “monthly” chart of the...
by Chris Kimble | Apr 3, 2020 | Kimble Charting
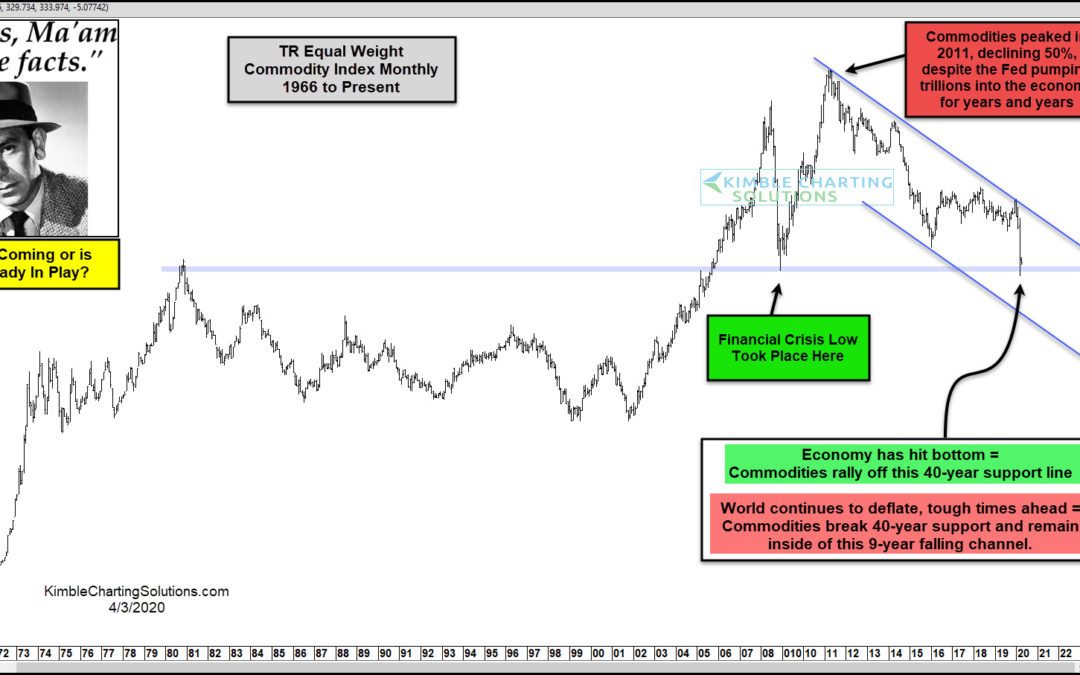
Are we headed towards a Depression or is the worst already behind us? In today’s world, comparisons to the great depression are easy to find. Are the Depression concerns well founded or are the declines of late already pricing in a bottom? In my humble opinion,...

by Chris Kimble | Apr 2, 2020 | Kimble Charting
Last week’s sharp rally off the lows, gave bulls some relief. But if the bulls are going to have reason to cheer, they will need to see another move higher… and fast! Why? Just look at today’s “weekly” price chart of the S&P 500 Index. This key broad-based index...
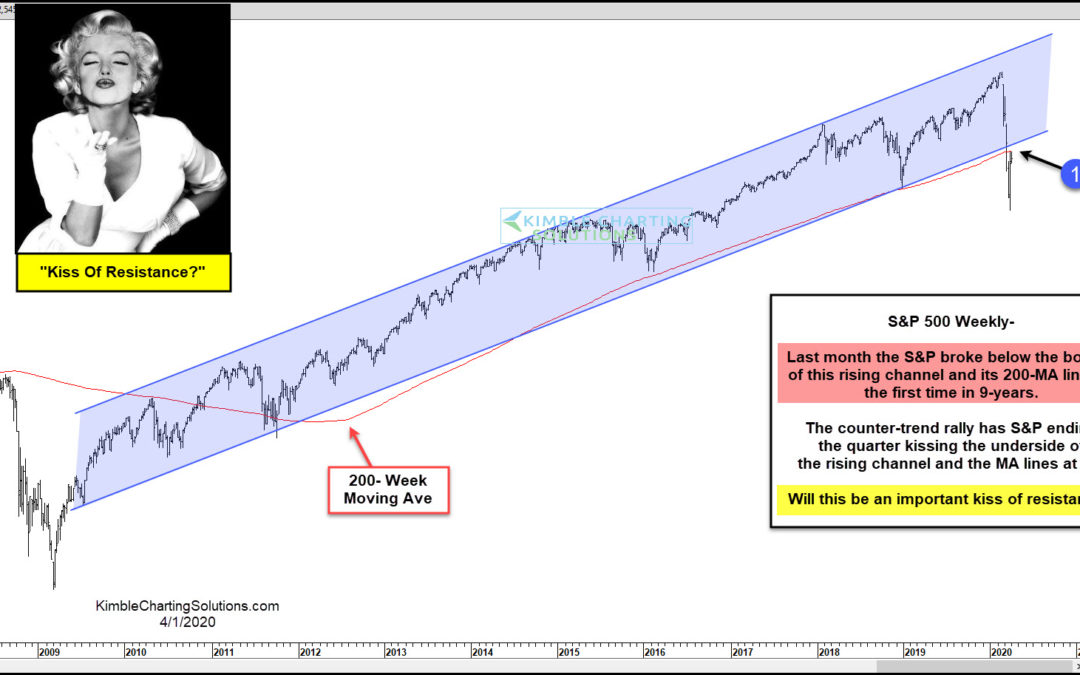
by Chris Kimble | Apr 1, 2020 | Kimble Charting
Is the S&P starting out a new month and quarter at a very important price point? This chart would say YES! This chart looks at the S&P 500 on a weekly basis over the past 12-years, reflecting that it has spent the majority of the past 9-years “inside of...
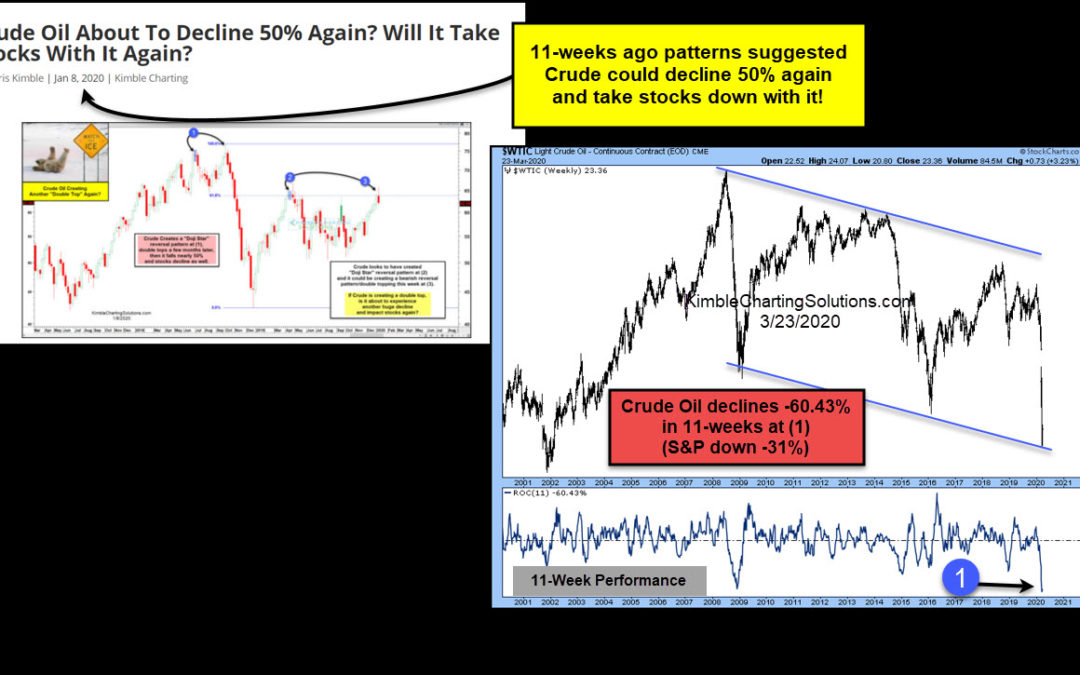
by Chris Kimble | Mar 26, 2020 | Kimble Charting
Crude Oil Topping Pattern and Market Crash Charts The importance of crude oil to the world economy cannot be overstated. Even with the rise of alternative fuel resources, oil remains king. This is why I monitor crude oil prices as a potential indicator for the economy...
