by Chris Kimble | May 10, 2022 | Kimble Charting
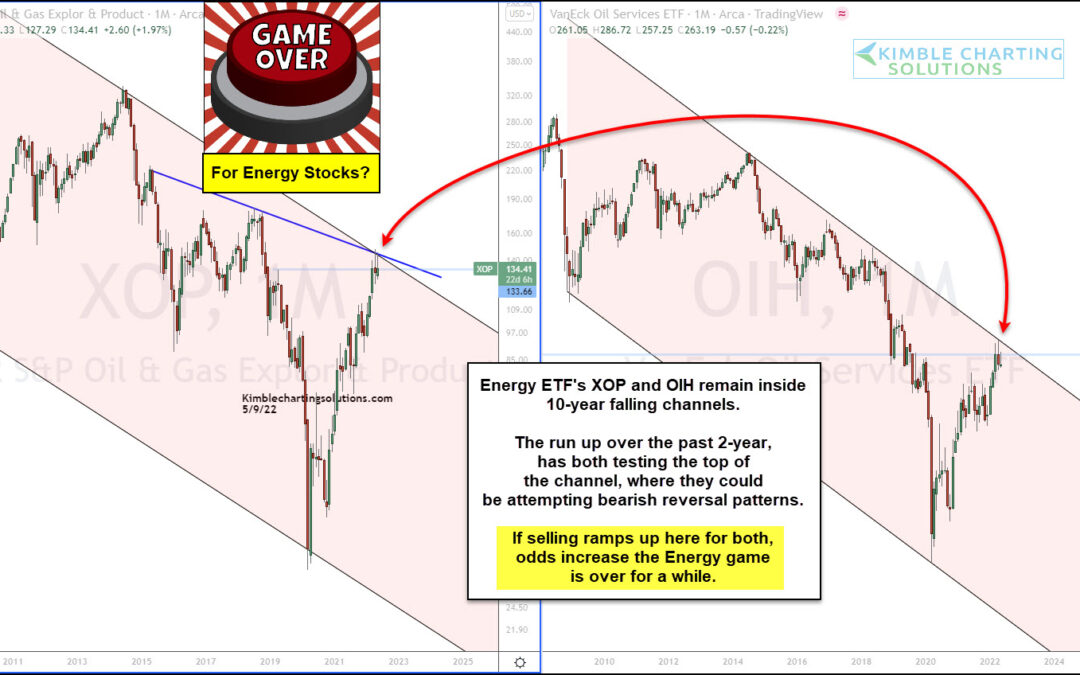
There haven’t been many places to hide during this year’s stock market correction (bear market?). And one of the last hiding places could be in trouble: Energy stocks. And more specifically, the Oil and Gas Exploration Sector ETF (XOP) and the Oil Services ETF (OIH)....
by Chris Kimble | Jan 26, 2022 | Kimble Charting
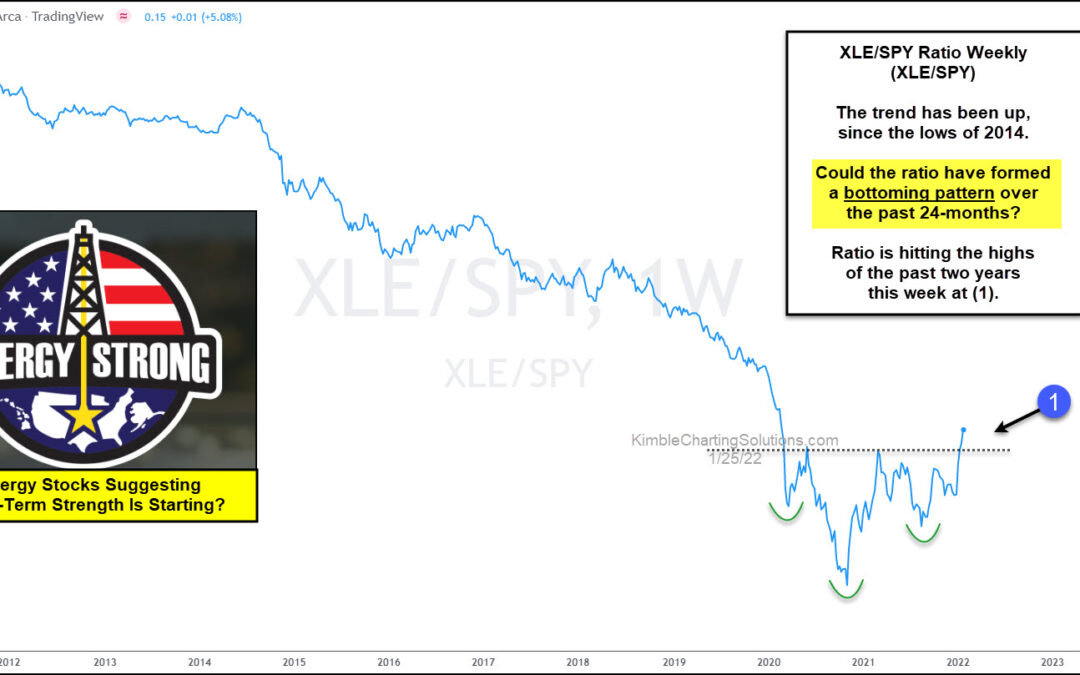
Energy stocks spent the decade of 2010 to 2020 mired in weakness… but is that trend coming to an end? The past two years have seen the Energy Sector (XLE) surge as Crude Oil has rallied back over $80. Today’s chart is a long-term “weekly” ratio chart of the Energy...
by Chris Kimble | Dec 10, 2020 | Kimble Charting
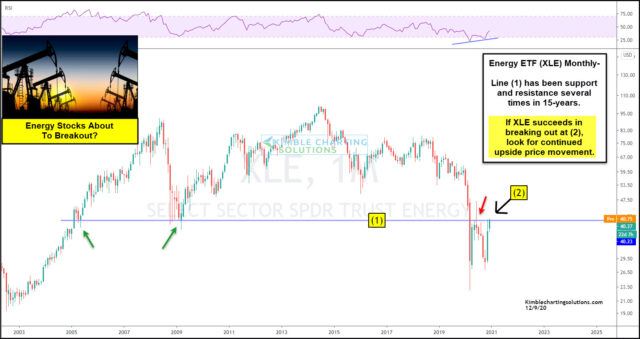
The energy sector is showing signs of life again? Should investors trust this move? We’ll let the price action speak for itself, but it investors should get a signal soon. Today’s chart take a long-term “monthly” view of the Energy Sector ETF (XLE) and highlights the...
by Chris Kimble | Dec 9, 2020 | Kimble Charting
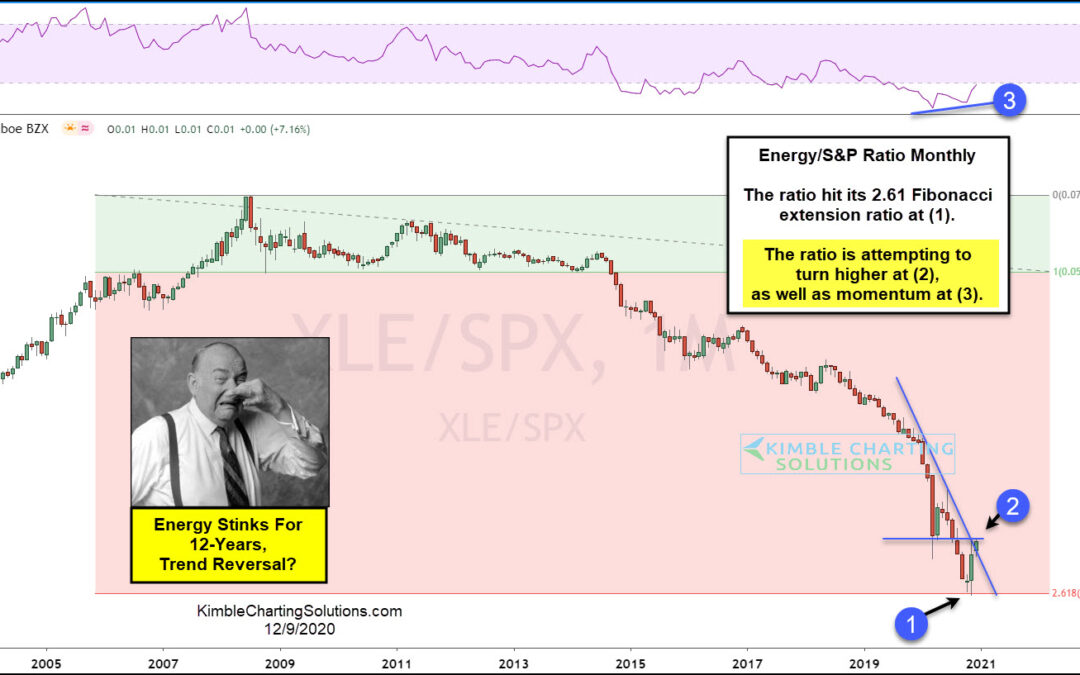
When it comes to sectors that have stunk it up over the past decade, Energy ETF (XLE) wins the award! This chart looks at the Energy ETF (XLE)/ S&P 500 ratio on a monthly basis over the past 17-years. The ratio has been creating lower highs and lower lows since...
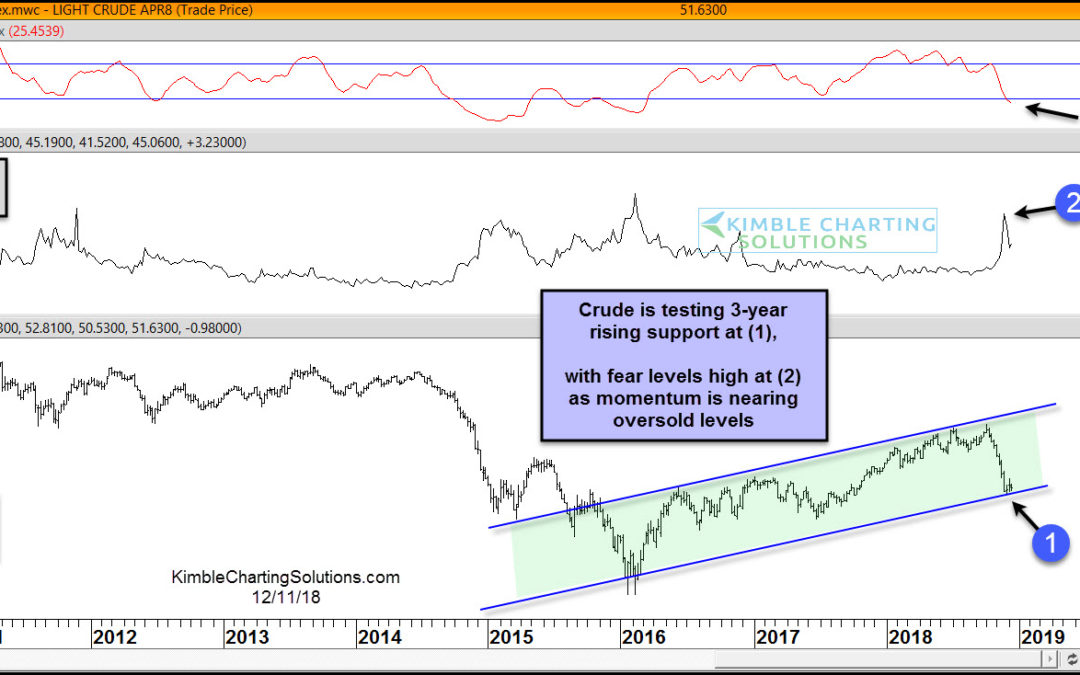
by Chris Kimble | Dec 11, 2018 | Kimble Charting
Crude oil has been hit hard of late. The decline has Crude testing 3-year rising support at (1), as fear levels are high at (2) and weekly momentum is currently nearing oversold levels. Below looks at Crude Oil and its 10-week performance – Crude Oil has...
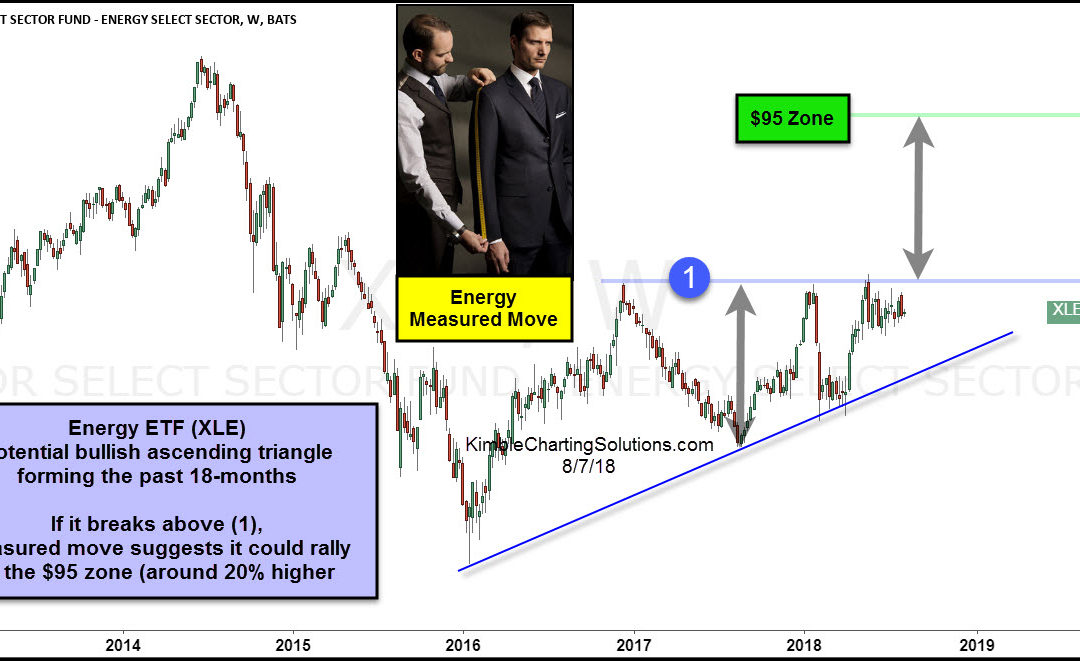
by Chris Kimble | Aug 7, 2018 | Kimble Charting
CLICK ON CHART TO ENLARGE Energy ETF (XLE) has struggled to get above the $80 level while creating a series of higher lows over the past 18-months. This price action could be creating a bullish ascending triangle pattern. The top of the pattern comes into play at the...
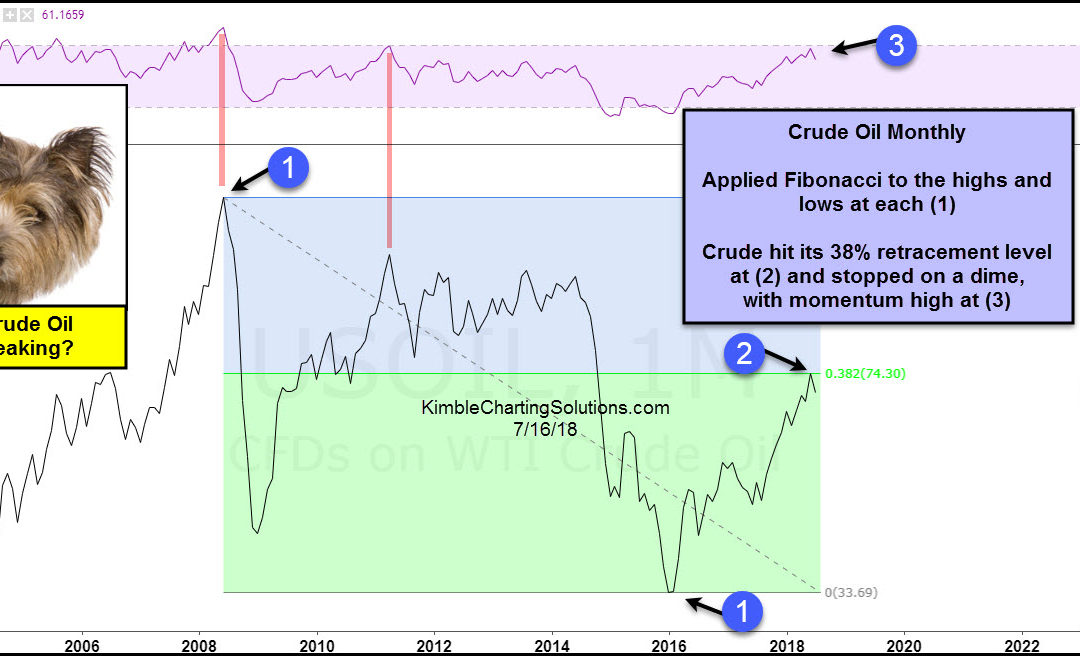
by Chris Kimble | Jul 16, 2018 | Kimble Charting
CLICK ON CHART TO ENLARGE The chart above looks at what could be the most important commodity on the planet, Crude Oil and its price action over the past 15-years. We applied Fibonacci retracement levels to the highs in 2008 and the lows in 2016, at each (1). The...
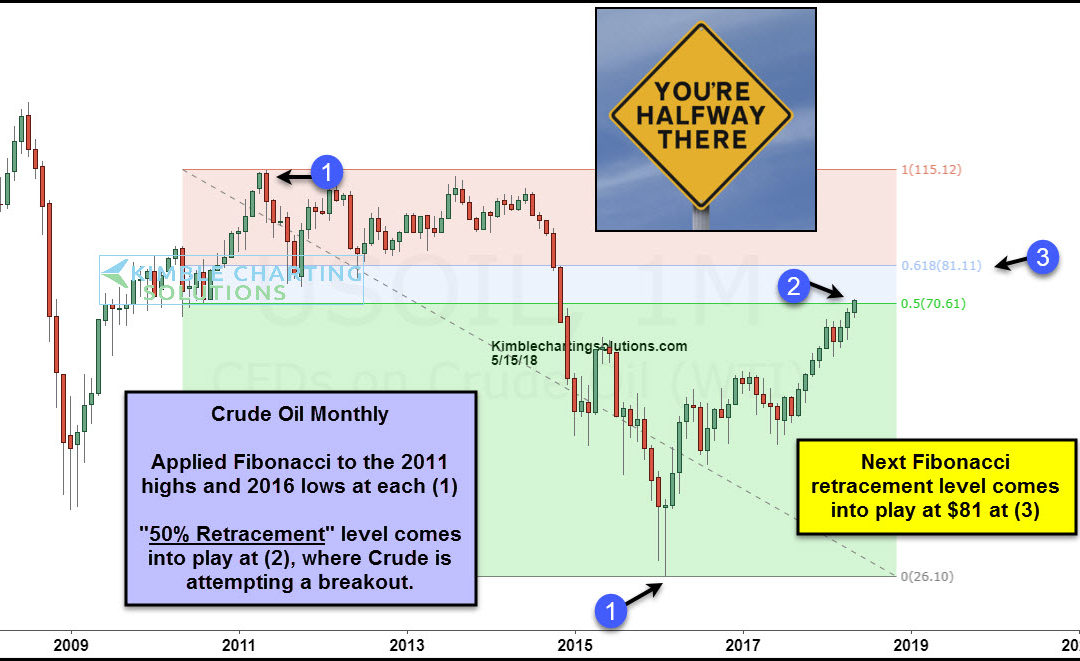
by Chris Kimble | May 15, 2018 | Kimble Charting
CLICK ON CHART TO ENLARGE This chart looks at Crude Oil on a monthly basis over the past decade. We applied Fibonacci retracement levels to the highs in 2011 and the lows in 2016 at each (1). The rally of late has Crude attempting to break out above the 50%...
