by Chris Kimble | Jul 12, 2018 | Kimble Charting
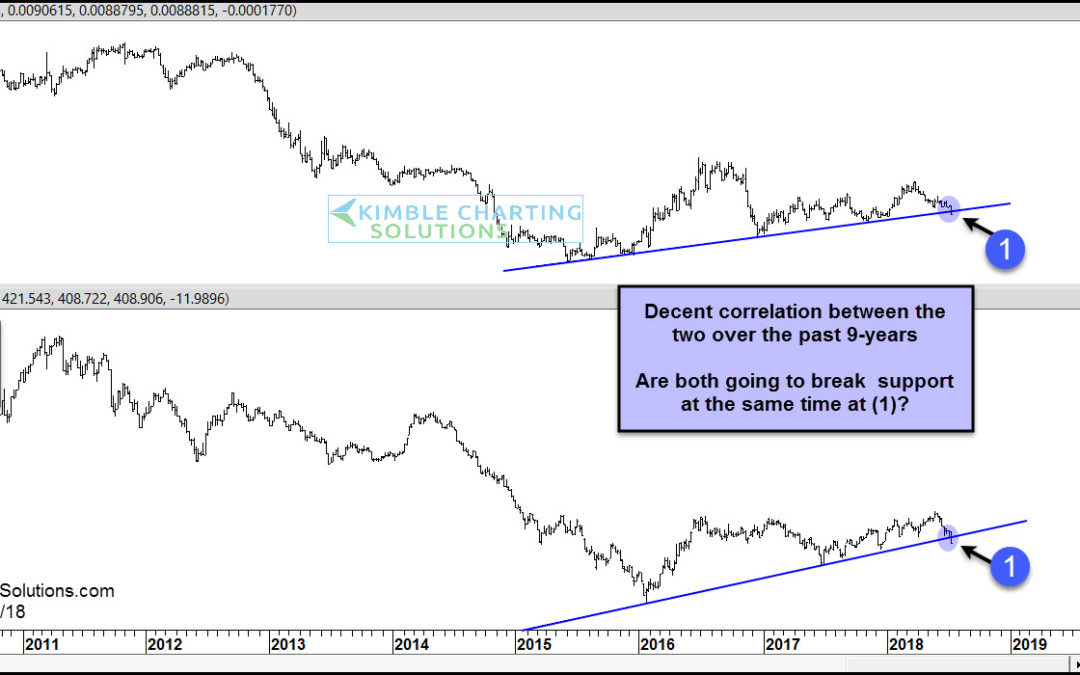
CLICK ON CHART TO ENLARGE The above chart looks at the Japanese Yen and the Thompson Reuters Equal Weight commodity index over the past 9-years, which reflects that the long-term trend for both remains lower. Both peaked in 2011-2012 and declined for the next 5-years....

by Chris Kimble | Feb 13, 2018 | Kimble Charting
Is King Dollar in trouble against the Japanese Yen? Could US$/Yen weakness send an concerning message to stock bulls? The following charts reflect that the US$/Yen and Nikkei 225 are testing some very important levels! Below looks at a chart of the US$/Yen over the...

by Chris Kimble | Sep 9, 2017 | Kimble Charting
Since 2011, it has paid to be long the US$/Yen, could that trend be about to change? Big test in play friends! Below looks at the US$/Yen over the past 8-years- CLICK ON CHART TO ENLARGE The trend is your friend and the trend in the US$/Yen still remains up at this...

by Chris Kimble | Apr 5, 2016 | Kimble Charting
CLICK ON CHART TO ENLARGE Sometimes currency price action can be very helpful, when it comes to whether one should own stocks or not. The US$/Yen has been correlated with stocks fairly well over the past few years. As the US$/YEN was hitting highs over the past year,...

by Chris Kimble | Sep 12, 2015 | Kimble Charting
CLICK ON CHART TO ENLARGE I have enjoyed looking at charts for the past 35-years. I must say, this pattern hasn’t happened many times in the past few decades and the results should be impactful to portfolio Construction. Continued US Dollar strength has brought...

by Chris Kimble | Jun 1, 2015 | Kimble Charting
CLICK ON CHART TO ENLARGE Almost 90-days ago the US Dollar was dealing with a 14-year resistance line that dated back to its all-time highs in 1985, around the 95 level. It pushed above this resistance line and closed just above the 100 level on the week ending...
by Chris Kimble | May 26, 2015 | Kimble Charting
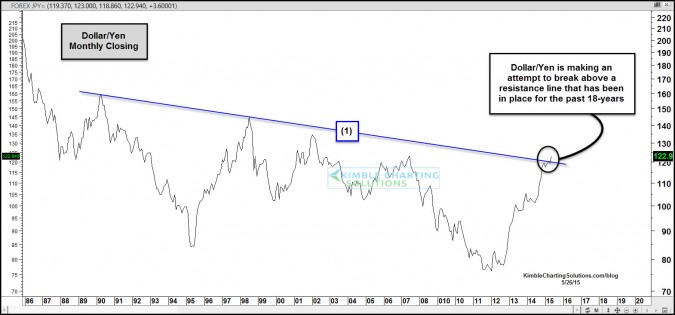
CLICK ON CHART TO ENLARGE The chart above takes a look at the U.S. Dollar/Yen ratio over the past few decades. Monthly resistance line (1) has been in play for the past 18-years. As the month of May is nearly over with, the US$/Yen is making an attempt to break above...

by Chris Kimble | Mar 23, 2015 | Global Dashboard, Kimble Charting
CLICK ON CHART TO ENLARGE The S&P 500 is near all-time highs. The Nikkei 225 can not say the same thing, as its remains nearly 50% below its monthly closing high back in 1989. This year, the Nikkei is doing much better than the S&P 500, up 10% more and it is...
