
by Chris Kimble | Sep 12, 2014 | Kimble Charting
CLICK ON CHART TO ENLARGE The Power of the Pattern suggested that interest rates were about to blast off in May of 2013, because it looked like a bullish inverse head & shoulders pattern in yields was in play. (see post here) What happened right...

by Chris Kimble | Jun 17, 2014 | Kimble Charting
CLICK ON CHART TO ENLARGE Its been a good year for bonds in just six months! Popular bond ETF TLT was up as much as 12% at the start of this month. Most investors would be happy to make 12% in a year owning government bonds. Is the six month rally in bonds...

by Chris Kimble | May 6, 2014 | Kimble Charting
CLICK ON CHART TO ENLARGE Tis the season to hear…”Sell in May and Go away!” This mantra comes from below average performance of stocks during the May to October time frame, compared to stronger stock performance from October to May. ...

by Chris Kimble | May 1, 2014 | Kimble Charting
CLICK ON CHART TO ENLARGE The no-brainer, can’t-miss trade of 2014 was supposed to be betting on higher interest rates. So how’s that working out for you? Apparently, not so good for Wall Street’s largest bond dealers that have seen their bearish trades...

by Chris Kimble | Mar 27, 2014 | Kimble Charting
CLICK ON CHART TO ENLARGE 2013 wasn’t kind to the bond market, one of the worst years in a long, long time. The decline in bond prices drove TLT down to its 38% Fibonacci retracement level. Could TLT be forming a bullish inverse head & shoulders...
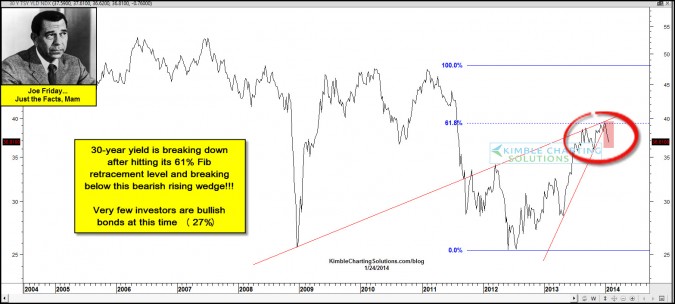
by Chris Kimble | Jan 24, 2014 | Kimble Charting
CLICK ON CHART TO ENLARGE The yield on the 30-year bond has created a multi-year bearish rising wedge and is breaking lower support of this bearish pattern above, after hitting its 61% Fibonacci retracement level. CLICK ON CHART TO ENLARGE The yield on the...

by Chris Kimble | Nov 22, 2013 | Kimble Charting
CLICK ON CHART TO ENLARGE Several times TLT has create “Double Bottoms” that was followed by rallies. TLT by well be creating a double bottom at the 38% Fibonacci level at (1) above and momentum is oversold. Joe Friday…it is critical for TLT to hold...

by Chris Kimble | Oct 23, 2013 | Kimble Charting
CLICK ON CHART TO ENLARGE Over the past 7 years a setup of, channel support, oversold momentum and very few bulls lead to declines in the 10-year yield of 15% to 60%! What was the flip of the yield declines? These large yield declines resulted in large...
