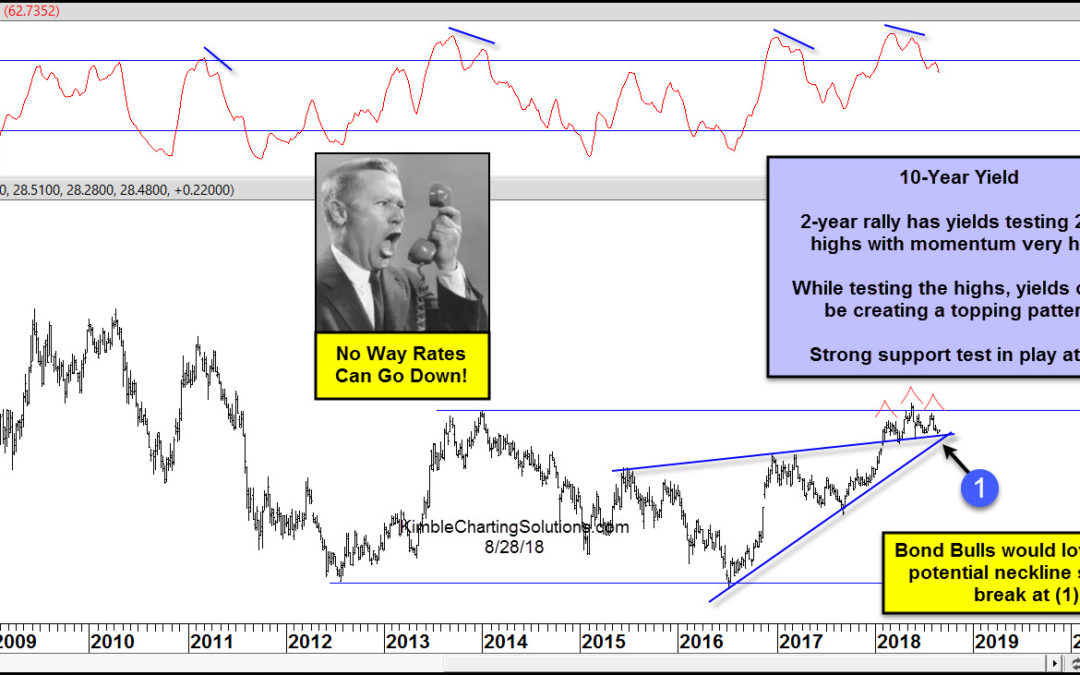
by Chris Kimble | Aug 28, 2018 | Kimble Charting
CLICK ON CHART TO ENLARGE With numerous stock indices hitting all-time highs, is it possible that interest rates could be peaking? It does seem unlikely in my humble opinion. This chart looks at the yield of the 10-year note (TNX), over the past 10-years. The rally...

by Chris Kimble | Jan 27, 2017 | Kimble Charting
If I told you that some assets have done really well post election, would that surprise you or the majority? Nah! What assets have done well post election or seem to be in the news of late? A strong rise in Banks, Materials, Energy and Interest Rates are just a few...

by Chris Kimble | Dec 9, 2016 | Kimble Charting
Below looks at the patterns on the S&P 500 and the Yield on the 10-year note (Inverted to look like bond prices), since the late 1980’s. A rare test of support and resistance by stocks and bonds, is in play right now! CLICK ON CHART TO ENLARGE The S&P...

by Chris Kimble | Dec 6, 2016 | Kimble Charting
Interest rates have shot up since this past July. Have they “stretched too far too fast?” One way to measure if an asset has made a rare/extreme short-term move, is too see how far above or below its 200 day moving average, it is. Below looks at the yield...

by Chris Kimble | Nov 10, 2016 | Kimble Charting
Interest rates did something for the first time in history yesterday, is that good news? Yesterday the yield on the 10-year note, had the largest single day rise in yields in all of history. Below looks at where yields stand after yesterdays historic rally. CLICK ON...

by Chris Kimble | Sep 17, 2015 | Kimble Charting, Sector / Commodity
For some reason, many around the world might be watching interest rates a little closer today, due to the Fed announcement this afternoon. Regardless of what the Fed does this afternoon, how do you make decisions in regards to rates and bond prices. Should you base...

by Chris Kimble | Feb 10, 2015 | Kimble Charting
CLICK ON CHART TO ENLARGE According to my parents and brother, when I was a kid I used to ask “What If” way too often. So this morning I am reverting back to my childhood (assuming I have actually grown up) and am asking “What If”...

by Chris Kimble | Sep 25, 2014 | Kimble Charting
CLICK ON CHART TO ENLARGE A sharp three week rally in government bond yields looks to have scared many investors. Bloomberg reported this morning that TLT just had it largest daily outflows in three years yesterday. This selling event looks to be taking...
