by Chris Kimble | Oct 22, 2015 | Kimble Charting
CLICK ON CHART TO ENLARGE Ryan Detrick, head of Statistical analysis for Kimble Charting Solutions and I were honored to be on a “Chart Art” panel this past week, at the Stocktoberfest meeting at Coronado Island. The main thrust of our talk was this;...

by Chris Kimble | Oct 14, 2015 | Global Dashboard, Kimble Charting
CLICK ON CHART TO ENLARGE The Dow formed what looks like a long-term “Megaphone” pattern in the late late 1960’s to early 1980’s. When it took out overhead resistance of the megaphone pattern in the mid 1980’s, it pretty much never looked...

by Chris Kimble | Sep 14, 2015 | Global Dashboard, Kimble Charting
For the bull market to keep running higher, it could well depend on what the Dax does at the 9,770 level! The 3-pack below looks at Germany, London and France. CLICK ON CHART TO ENLARGE This 3-pack looks at the DAX, FTSE 100 and the CAC 40 over the past 20-years. As...

by Chris Kimble | Aug 26, 2015 | Global Dashboard, Kimble Charting
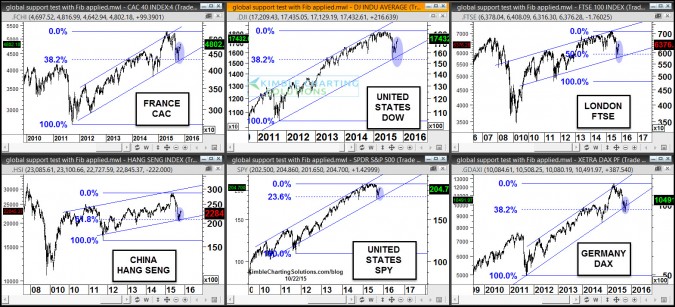
The majority of the worlds stocks markets have been in an uptrend the past few years. The global stock market sell off now has the majority of these stock markets testing bull market support channels right now. CLICK ON CHART TO ENLARGE As you can see from the 6-pack...

by Chris Kimble | Jun 19, 2015 | Kimble Charting
CLICK ON CHART TO ENLARGE Joe Friday Just The Facts… The Shanghai index has had a rough week, down 13.32%. This was the 8th worst weekly decline in the past 25-years. Any reasons this could be happening? Below looks at the Shanghai index over the past 20 years...

by Chris Kimble | Jun 17, 2015 | Global Dashboard, Kimble Charting
While much of the talk seems to be around Greece of late, investors might want to keep a close eye on what is taking place in Germany, London and France! Below looks at the DAX index over the past 15-years CLICK ON CHART TO ENLARGE The DAX hit the Fibonacci 161%...
by Chris Kimble | May 29, 2015 | Kimble Charting
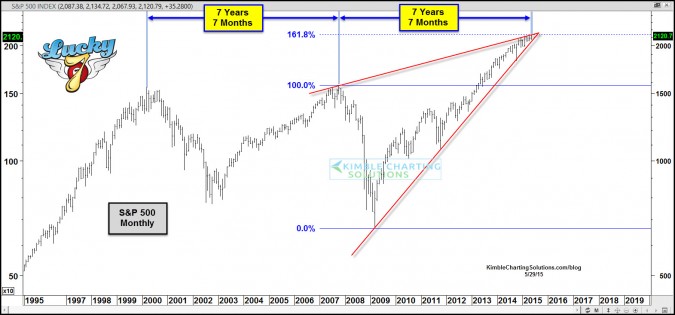
CLICK ON CHART TO ENLARGE Could the S&P 500 be pulling a repeat of the 2000-2007 topping process? The chart above reflects that the tops in 2000 & 2007 were 7 years and 7 months apart. Is it possible that another top is taking place 7 years and 7 months from...

by Chris Kimble | Oct 7, 2014 | Kimble Charting
This morning the IMF lowered its forecast for global growth. Are they attempting to lower the bar on expectations going forward? Do they know something we don’t? Should one pay attention to forecasts or prices? CLICK ON CHART TO ENLARGE The...
