by Chris Kimble | Mar 26, 2020 | Kimble Charting
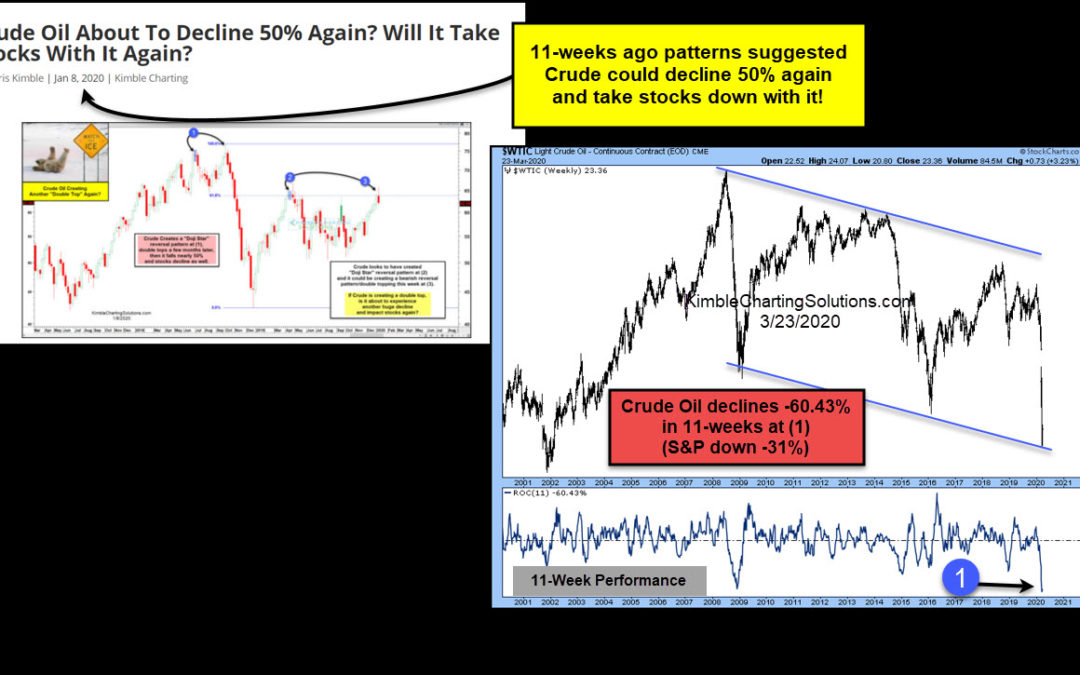
Crude Oil Topping Pattern and Market Crash Charts The importance of crude oil to the world economy cannot be overstated. Even with the rise of alternative fuel resources, oil remains king. This is why I monitor crude oil prices as a potential indicator for the economy...
by Chris Kimble | Mar 20, 2020 | Kimble Charting
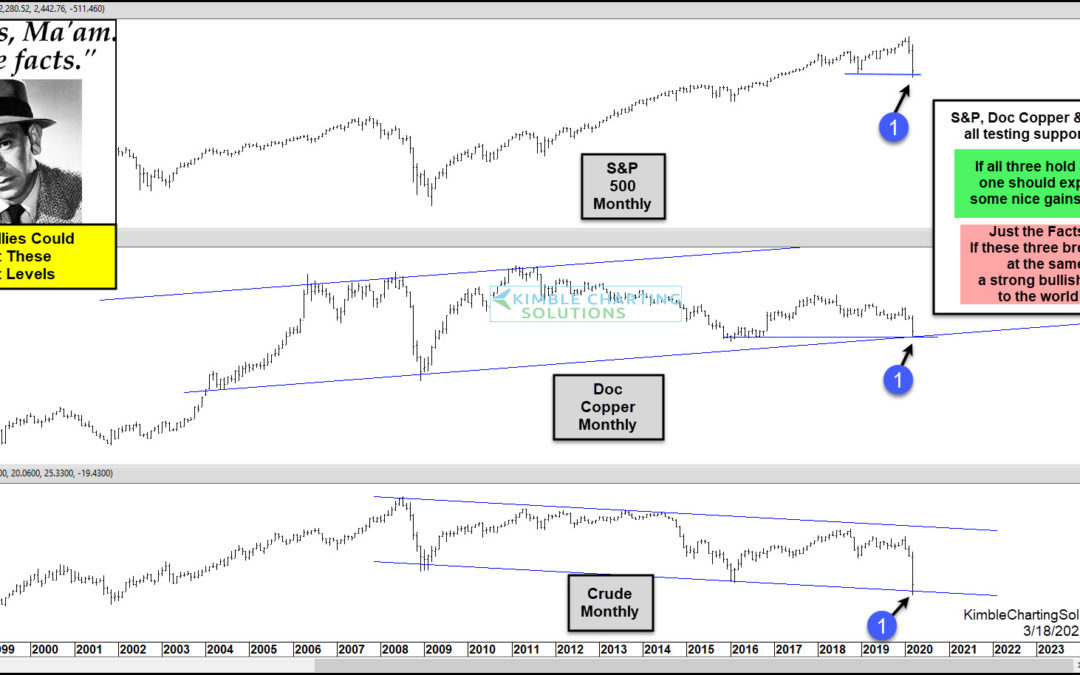
The past couple of months has delivered a lot of bad news for investors. Several key ingredients to a healthy bull market have fallen sharply, including stocks, Doc Copper, and Crude Oil. In fact, all 3 have entered bear market territory in 2020. For the year, the...

by Chris Kimble | Mar 10, 2020 | Kimble Charting
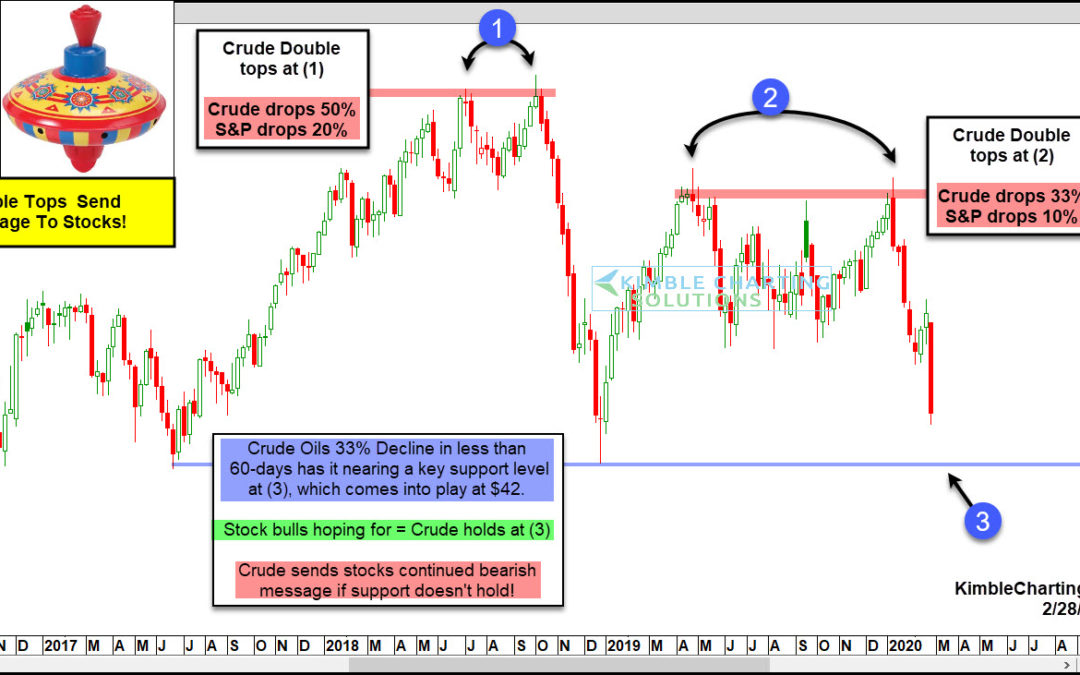
The coronavirus has caused severe economic uncertainty, as economists are beginning to weigh its effect on economic growth. This has brought heightened levels of fear into the financial markets, sending both stocks and economically sensitive commodities like Crude Oil...
by Chris Kimble | Mar 3, 2020 | Kimble Charting
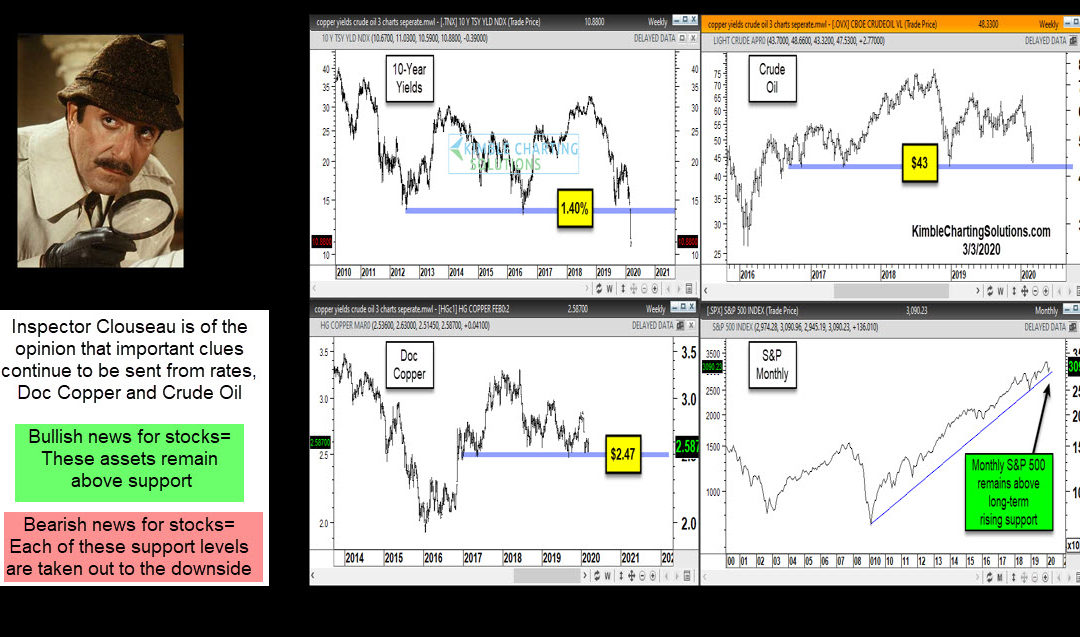
Will the economy experience a “Demand Shock?” Consumers stay at home and don’t buy many items. Will the economy experience a “Supply Shock?” Workers stay home and don’t create many products. Will a combo of both take place or...
by Chris Kimble | Feb 28, 2020 | Kimble Charting
Crude Oil created its second top back in October of 2018 at (1) and then it proceeded to decline nearly 50%! What did the S&P do while Crude declined 50%, it fell nearly 20% in less than 90-days! The above chart was shared on 1//8/2000, suggesting that Crude Oil...
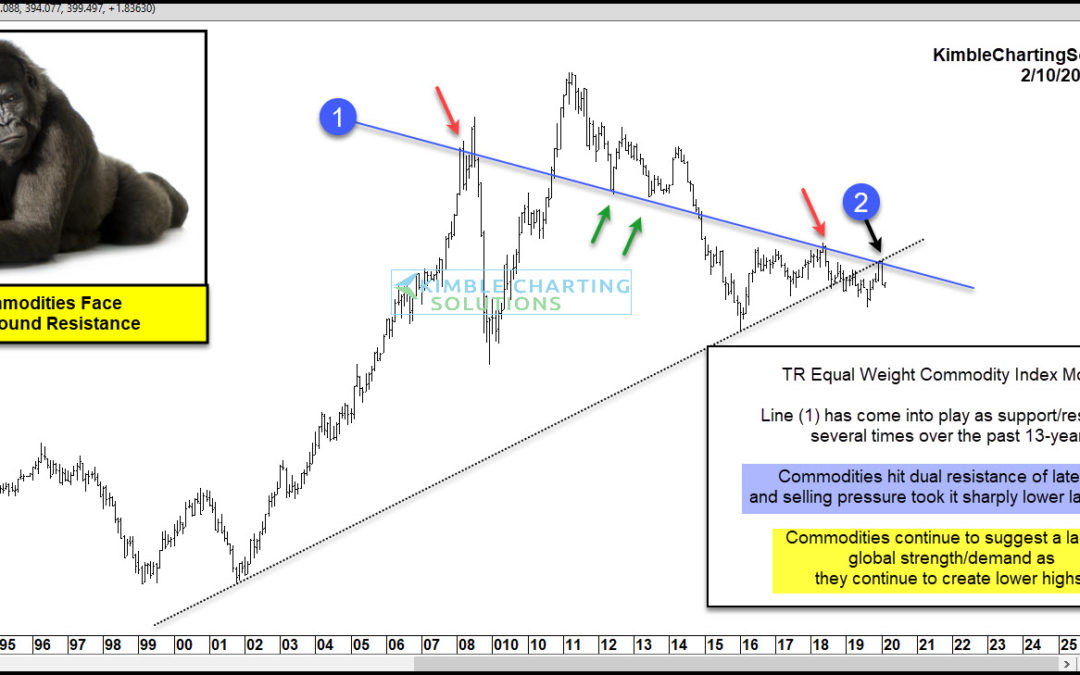
by Chris Kimble | Feb 10, 2020 | Kimble Charting
Are commodities suggesting a lack of demand is in play on a global basis? Possible! Could this impact stocks? So far it has not! The chart looks at the Thompson/Reuters Commodities Index over the past 30-years. This index has created a series of lower highs since it...
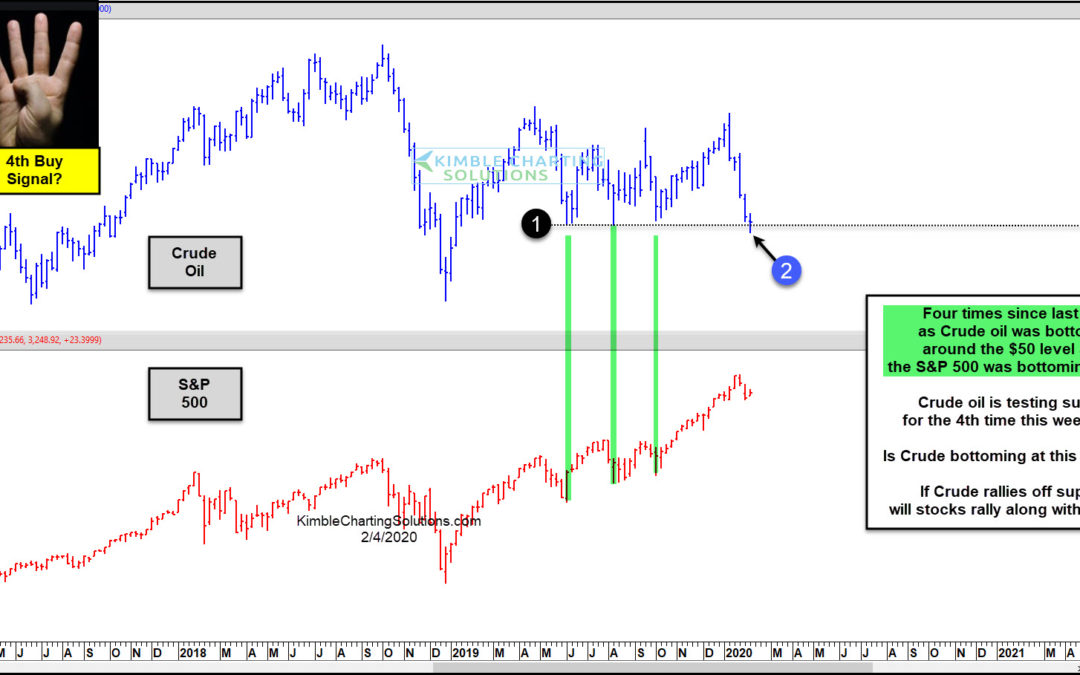
by Chris Kimble | Feb 4, 2020 | Kimble Charting
Is Crude Oil bottoming for the 4th time the last 8-months? Is Crude Oil suggesting that stocks are at a low about to experience a strong rally? Crude Oil has rallied off support line (1), which is the $50 level, three different times since May of 2019. Each time Crude...
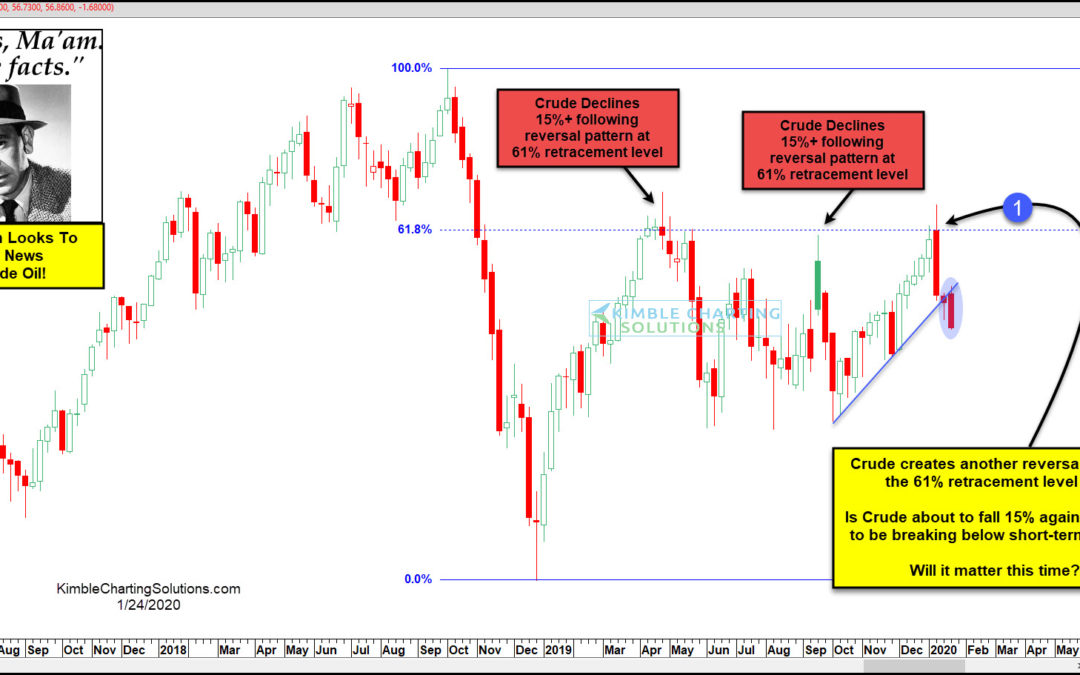
by Chris Kimble | Jan 24, 2020 | Kimble Charting
It’s a good idea for investors to be aware of key indicators and inter-market relationships. Perhaps it’s watching the US Dollar as an indicator for precious metals or emerging markets. Or watching interest rates for the economy. Experience, history, and relationships...
