
by Chris Kimble | Jun 24, 2015 | Kimble Charting
CLICK ON CHART TO ENLARGE The chart looks the the DJ Transportation Index on a monthly basis. Pretty simple friends…Support off the 2009 lows was broken last month. This month, the index rallied and kissed the underside of the line at (1) and looks to be pushing...

by Chris Kimble | Jun 19, 2015 | Kimble Charting
CLICK ON CHART TO ENLARGE Joe Friday Just The Facts… The Shanghai index has had a rough week, down 13.32%. This was the 8th worst weekly decline in the past 25-years. Any reasons this could be happening? Below looks at the Shanghai index over the past 20 years...

by Chris Kimble | Jun 17, 2015 | Global Dashboard, Kimble Charting
While much of the talk seems to be around Greece of late, investors might want to keep a close eye on what is taking place in Germany, London and France! Below looks at the DAX index over the past 15-years CLICK ON CHART TO ENLARGE The DAX hit the Fibonacci 161%...

by Chris Kimble | Jun 2, 2015 | Kimble Charting
When it comes to global stock market leadership, the DAX comes to mind. Since the DAX hit a low during the Ebola scare last October, it is up 32% since 10/17/2014 (see lower inset chart) CLICK ON CHART TO ENLARGE The DAX has been soft the past 7 weeks after it hit...

by Chris Kimble | May 21, 2015 | Kimble Charting
When it comes to Red Hot stock markets the Shanghai index fits the bill. Below looks at the Year-To-Date performance of the Shanghai, DAX and S&P 500 indices. CLICK ON CHART TO ENLARGE As you can see the S&P 500 is lagging big time this year and even though...
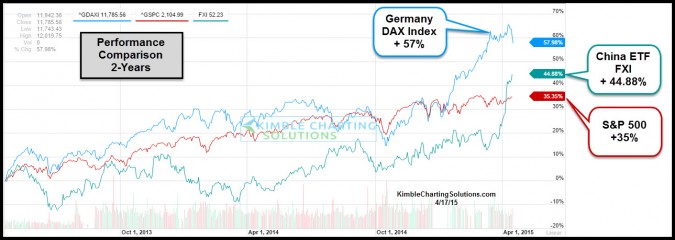
by Chris Kimble | Apr 17, 2015 | Kimble Charting
CLICK ON CHART TO ENLARGE When it comes to investing in the stock market, do you feel leadership can be important. If so, you might want to pay attention to price action from a key global stock index. China has been in the news for hot stock market performance that...
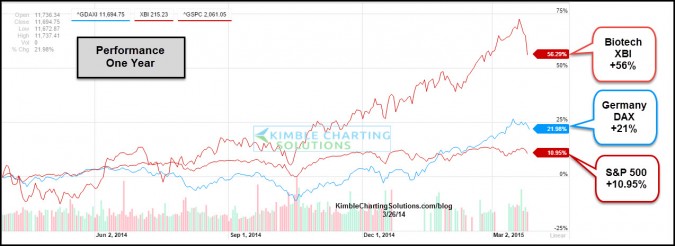
by Chris Kimble | Mar 26, 2015 | Kimble Charting
CLICK ON CHART TO ENLARGE I am a fan of watching leadership. When leaders get into trouble, they can have a huge influence over the broad markets. The above chart looks at the S&P 500 and the hottest sector and hottest key global stock index of late. Over the past...

by Chris Kimble | Mar 10, 2015 | Global Dashboard, Kimble Charting
CLICK ON CHART TO ENLARGE The Power of the Pattern believes it is important to keep a close eye on how leading stock indices are doing. The DAX index has been HOT over the last year, up 25% in the past year. The chart below reflects that it up over twice what the...
