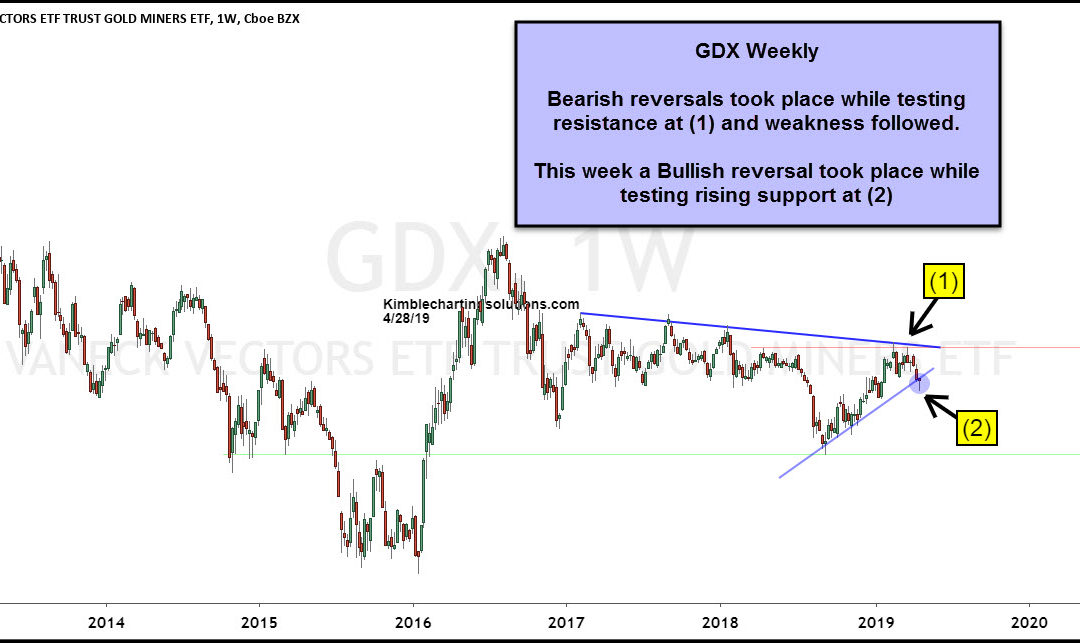
by Chris Kimble | Apr 28, 2019 | Kimble Charting
Two months ago Gold Miners ETF GDX created its first bearish reversal pattern (bearish wick) while testing falling resistance. A couple of weeks later it created another bearish reversal pattern (Bearish wick) and then selling pressure took over and GDX fell 10%...

by Chris Kimble | Nov 15, 2018 | Kimble Charting
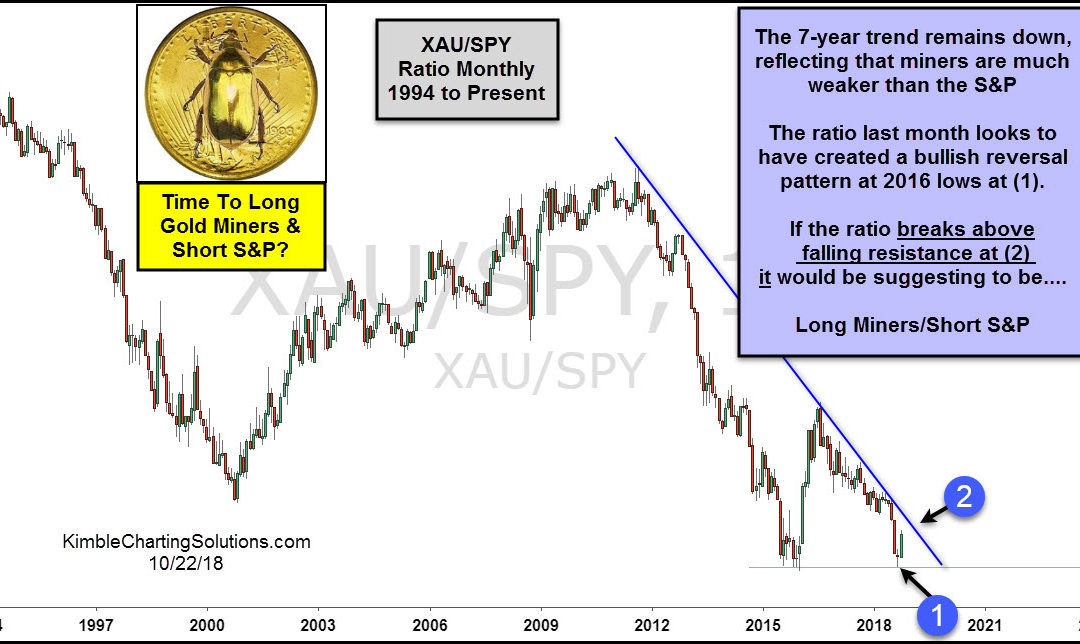
Gold, Silver, and the precious metals industry have a pretty simple relationship with the U.S. Dollar: They perform better when the Dollar is weakening… and they tend to struggle when the Dollar is strengthening. One of our favorite ratios to monitor for Gold Bugs is...
by Chris Kimble | Oct 23, 2018 | Kimble Charting
The precious metals sector continues to be a “grind”, offering a few trades but mostly sideways to lower action. Gold prices have slogged along and this had held the Gold Miners (NYSEARCA:GDX) back… until recently. The Gold Miners (GDX) and the broader Gold &...

by Chris Kimble | Jan 31, 2018 | Kimble Charting
The 6-pack below updates chart patterns from the Gold and Steel sector that we share often on this blog. It is shared weekly with our Metals and Premium Members. The 6-pack below looks at Gold, Gold Miners (GDX & GDXJ), GDXJ/GDX ratio, Gold/US$ ratio and Steel ETF...

by Chris Kimble | Jan 2, 2018 | Kimble Charting
Junior Gold Miners ETF (GDXJ) has been reflecting actual and relative strength of late compared to the S&P 500. On December the 20th the Power of the Pattern shared that GDXJ had hit an important support line and was experiencing a short-term breakout. See 12/20...

by Chris Kimble | Nov 2, 2017 | Kimble Charting
The 6-pack below looks at several charts in the metals sector (Gold, Gold Miners, and Steel). Each looks to be facing something similar at the same time. CLICK ON CHART TO ENLARGE Each asset or ratio above has something similar in play in the short and long-term. In...

by Chris Kimble | Sep 21, 2017 | Kimble Charting
Gold & Silver long-term trends have been lower since highs back in 2011. Counter trend rallies have continued to frustrate metals bulls as they continue to fizzle out. Are current counter trend rallies in Gold & Silver about to fizzle out again? Below looks at...
by Chris Kimble | Sep 8, 2017 | Kimble Charting
Gold has been weaker than the US$ since 2011 highs, highlighted in Gold/Dollar chart below. The ratio is attempting to do something this week that it hasn’t been able to accomplish the past few years- CLICK ON CHART TO ENLARGE The ratio has traded sideways for...
