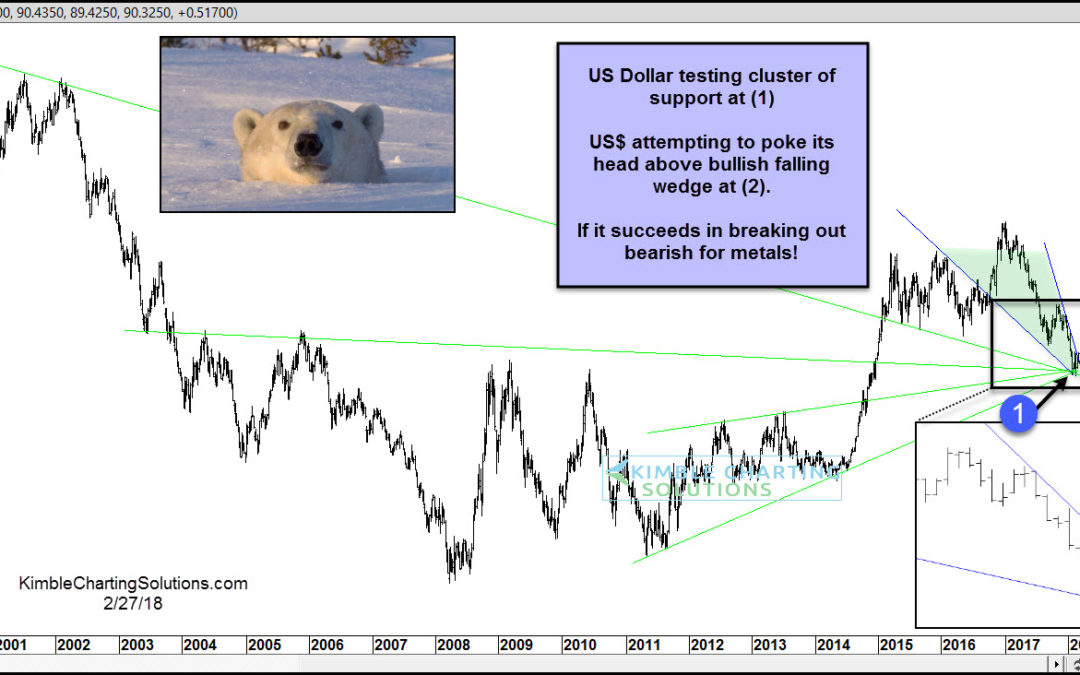
by Chris Kimble | Feb 28, 2018 | Kimble Charting
The last 14 months has seen the US Dollar Index fall nearly 15 percent (top to bottom). Sentiment toward the dollar has turned bearish as well. From a contrarian standpoint, the US Dollar Index is nearing an oversold bounce. But could it lead to a stronger rally than...
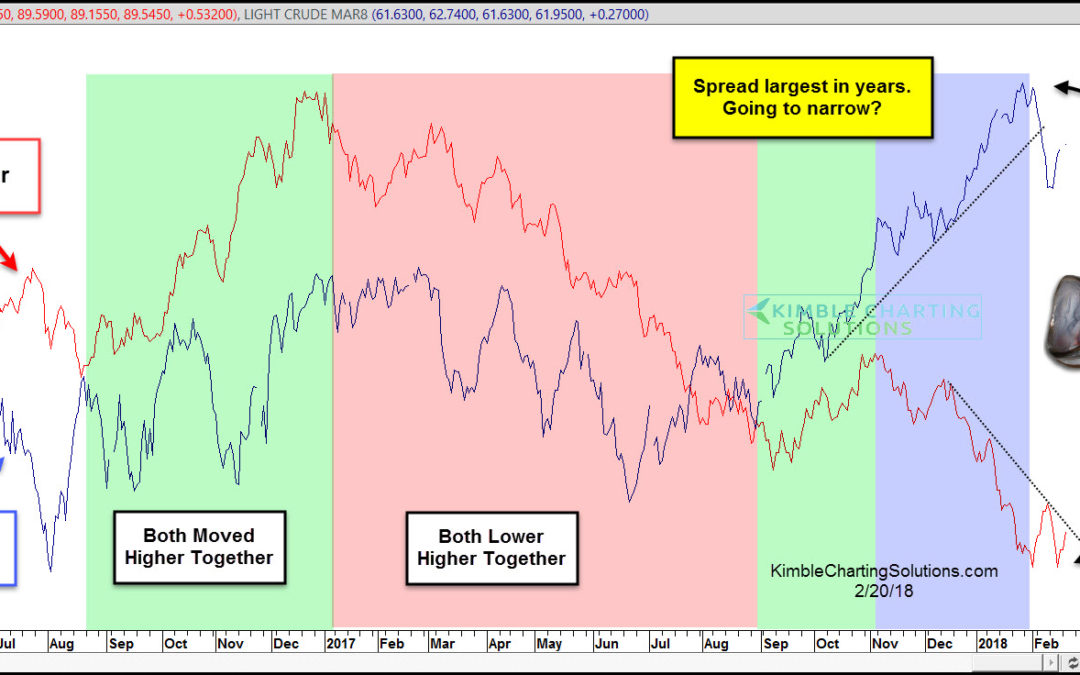
by Chris Kimble | Feb 20, 2018 | Kimble Charting
CLICK ON CHART TO ENLARGE King Dollar & Crude Oil sometimes dance to the same tune (correlate) and sometimes they head in opposite directions (non-correlate). Above looks at the correlation between the two over the past couple of years. From September of 2016...

by Chris Kimble | Feb 20, 2018 | Kimble Charting
Certain price zones for all assets come into play where bulls would not want to see selling get started. Below highlights one of those points for Gold Bulls. The left chart looks at Gold over the past 20-years and the right chart zooms in to look at just the past...
by Chris Kimble | Jan 29, 2018 | Kimble Charting
The US Dollar has experienced a decline over the past 13-months that hasn’t happened many times in the past 10-years. Below looks at King Dollar’s performance over the past 13-months (upper left) at (1), reflecting that it has declined nearly 13% in that...
by Chris Kimble | Jan 26, 2018 | Kimble Charting
The past 11 and 7-years respectively have not been kind to the Euro and Gold, as each has created a series of lower highs and lower lows for years. The dual chart below looks at the Euro and Gold and the long-term bear market each has been in- CLICK ON CHART TO...
by Chris Kimble | Jan 5, 2018 | Kimble Charting
In 2011 the Power of the Patttern suggested that Gold could be flat to down for years to come. See post HERE Since that post in 2011, Gold finds itself down around 30% and Silver is down over 65%. 2011 saw extremes in prices. After nearly 7-years of lower prices,...

by Chris Kimble | Sep 14, 2017 | Kimble Charting
Two of 2017’s major investing themes thus far are the return of Gold (NYSEARCA:GLD) and the prolonged weakness in the U.S. Dollar (CURRENCY:USD). Year-to-date, Gold is up 15.72% while the U.S. Dollar is down 9.57%. This follows a multi-year decline in Gold and a...
by Chris Kimble | Aug 15, 2017 | Kimble Charting
The US Dollar so far this year, has been very week, losing nearly 10% of its value. This decline might have influenced investors to go long the Euro. Below looks at sentiment towards the Euro, that we shared on our Twitter & Stocktwits accounts 9-days ago. CLICK...
