
by Chris Kimble | Nov 30, 2017 | Kimble Charting
Rocky took some many punches and kept coming back. Fighting the trends highlighted below might be a little painful to the pocketbook. Below looks at three broad-based indices on a monthly basis over the past few decades- CLICK ON CHART TO ENLARGE Breakouts continue to...

by Chris Kimble | Jun 16, 2016 | Uncategorized
CLICK ON CHART TO ENLARGE The chart above looks at the Value Line Geometric Index over the past 20-years. This index potentially has created a “Triple Top” over the past 18-years at (1). In my humble opinion, what counts at this time is NOT whether this is...

by Chris Kimble | Apr 28, 2016 | Kimble Charting
Below takes a look at the Valu-Line index over the past couple of decades. Could a “Triple Top” be in play in the broad based index? CLICK ON CHART TO ENLARGE One year ago this week (4/24/15) the Valu Line peaked, as it was hitting the highs it reached in...

by Chris Kimble | Mar 3, 2016 | Kimble Charting
CLICK ON CHART TO ENLARGE The 3-pack above looks at three very broad indices in the states. Each chart is based upon monthly prices. Each index remains inside of 5-year rising channels and each has declined in price over the past year. The declines in price, has taken...

by Chris Kimble | Feb 11, 2016 | Kimble Charting
The Power of the Pattern would describe a bull trend, based upon a series of higher lows and higher highs. Using this definition, the broadest of indices in the states, are “breaking 5-year rising trends!” This could break the heart of the bulls. CLICK ON...

by Chris Kimble | Jul 22, 2015 | Kimble Charting
CLICK ON CHART TO ENLARGE I shared this chart with members last week, taking a long-term look at one index in the states and one from Europe, that both look a ton alike! This 2-packs at the Valu-Line Geometric index and the FTSE-100 from London. Both hit highs in 2000...

by Chris Kimble | Feb 24, 2015 | Global Dashboard, Kimble Charting
CLICK ON CHART TO ENLARGE The above 3-pack looks at the Value Line Geometric, Nasdaq 100 and Nikkei 225 since 1990, on a “Monthly Closing” basis. As you can see the Value Line is attempting to make a triple top breakout, the Nikkei is attempting to break...
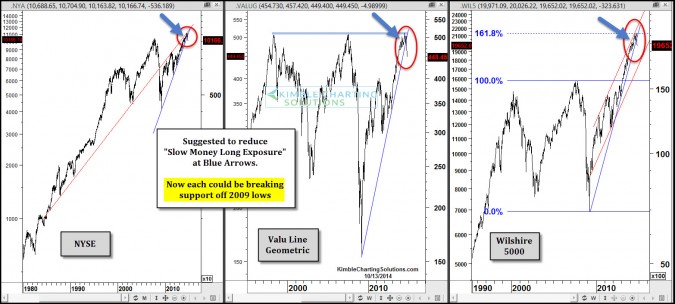
by Chris Kimble | Oct 14, 2014 | Kimble Charting
CLICK ON CHART TO ENLARGE The Power of the Pattern suggested to pull some “Slow Money Long Exposure” off the table at the blue arrows above. One of our goals is to help financial professionals and investors who don’t care to trade very...
