
by Chris Kimble | Oct 14, 2015 | Global Dashboard, Kimble Charting
CLICK ON CHART TO ENLARGE The Dow formed what looks like a long-term “Megaphone” pattern in the late late 1960’s to early 1980’s. When it took out overhead resistance of the megaphone pattern in the mid 1980’s, it pretty much never looked...

by Chris Kimble | Oct 1, 2015 | Global Dashboard, Kimble Charting, Sector / Commodity
CLICK ON CHART TO ENLARGE We often receive requests for information about our Premium Program and we are deeply humbled and honored by them! Above illustrates what Premium Members receive, ranging from personal contact with me, to daily Power of the Pattern...

by Chris Kimble | Sep 28, 2015 | Global Dashboard, Kimble Charting
CLICK ON CHART TO ENLARGE The Nasdaq 100 index has remained inside of this rising channel for the past 5-years. The herd continues to buy the dip along support of this rising channel. Last week the NDX 100 close a couple of percent lower on the week and it closed very...

by Chris Kimble | Sep 17, 2015 | Kimble Charting, Sector / Commodity
For some reason, many around the world might be watching interest rates a little closer today, due to the Fed announcement this afternoon. Regardless of what the Fed does this afternoon, how do you make decisions in regards to rates and bond prices. Should you base...

by Chris Kimble | Sep 14, 2015 | Global Dashboard, Kimble Charting
For the bull market to keep running higher, it could well depend on what the Dax does at the 9,770 level! The 3-pack below looks at Germany, London and France. CLICK ON CHART TO ENLARGE This 3-pack looks at the DAX, FTSE 100 and the CAC 40 over the past 20-years. As...
by Chris Kimble | Sep 9, 2015 | Global Dashboard, Kimble Charting
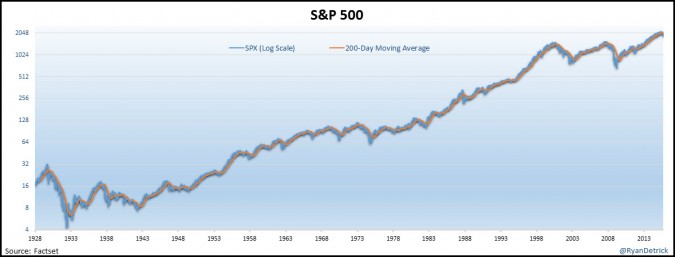
Today’s post is from my good friend Ryan Detrick. He had some unique thoughts and stats on the 200-day moving average, Thank You Ryan for your contributions! We hear a lot about the S&P 500 and its 200-day moving average. It is trading above or below...
by Chris Kimble | Sep 8, 2015 | Global Dashboard, Kimble Charting
Around 100 years ago Charles Dow came up with the idea of the Dow Theory. The theory was derived from 255 Wall Street Journal editorials written by Charles H. Dow(1851–1902), journalist, founder and first editor of The Wall Street Journal and co-founder of Dow Jones...

by Chris Kimble | Sep 1, 2015 | Global Dashboard, Kimble Charting
CLICK ON CHART TO ENLARGE Could a price zone that started impacting the Nikkei 30-years ago still impact it again today? Well it looks like it is! The Nikkei found the 21,000 level, line (1), to be support several times between 1987 and 1992. Once this support broke...
