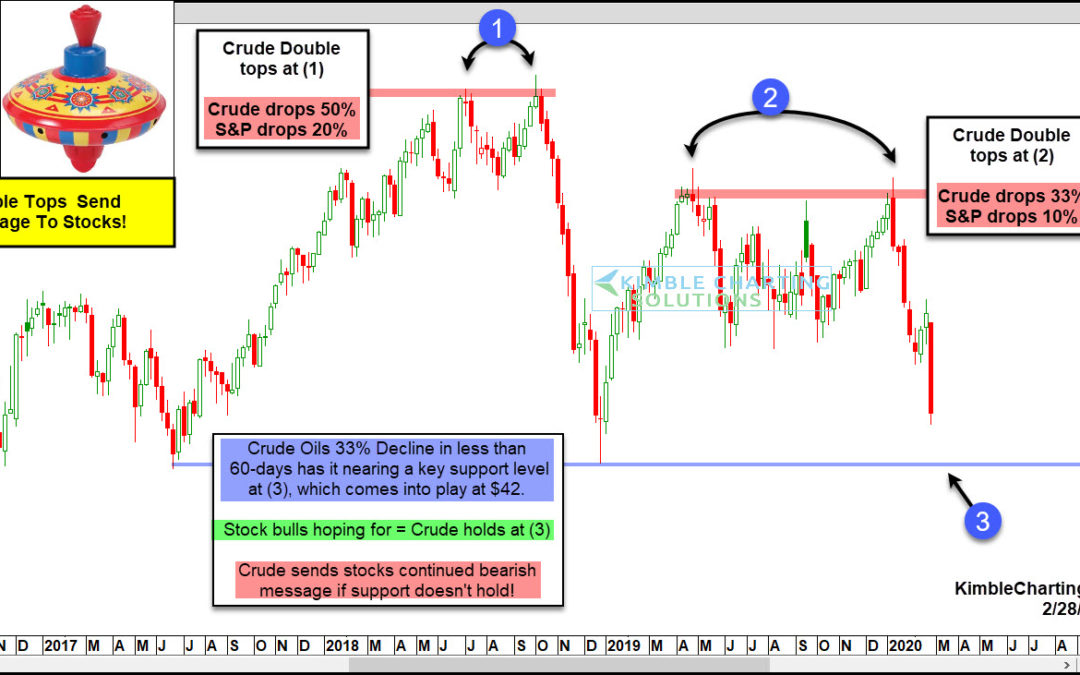
by Chris Kimble | Feb 28, 2020 | Kimble Charting
Crude Oil created its second top back in October of 2018 at (1) and then it proceeded to decline nearly 50%! What did the S&P do while Crude declined 50%, it fell nearly 20% in less than 90-days! The above chart was shared on 1//8/2000, suggesting that Crude Oil...
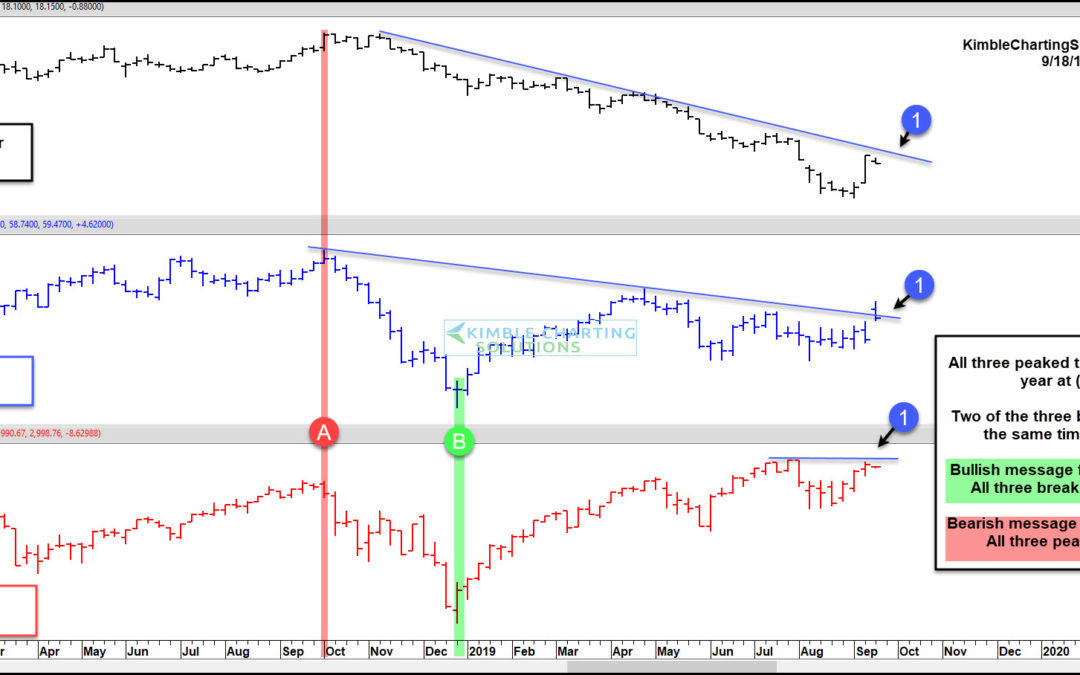
by Chris Kimble | Sep 18, 2019 | Kimble Charting
It’s not often that three asset classes reach similar important trading points all at once. But that’s exactly what’s happening right now with stocks, crude oil, and treasury bond yields. And this is occurring on Federal Reserve day no less! Something has got to give....

by Chris Kimble | Sep 11, 2019 | Kimble Charting
U.S. Treasury Bond Yields – 2, 5, 10, 30 Year Durations The past year has seen treasury bond yields decline sharply, yet in an orderly fashion. This has spurred recession concerns for much of 2019. Needless to say, it’s a confusing time for investors. In today’s chart...
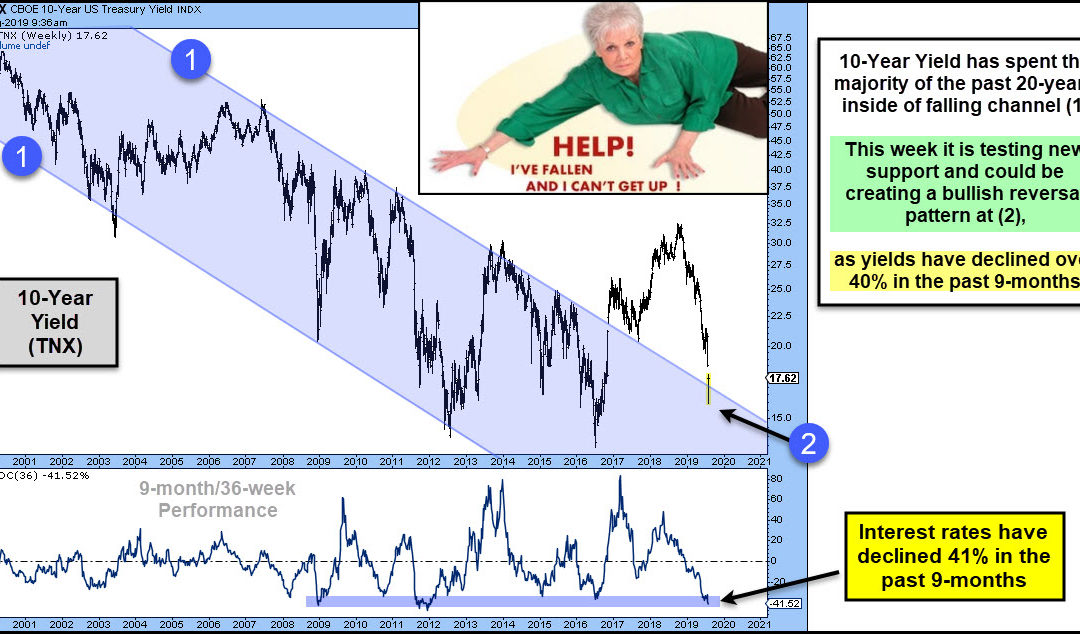
by Chris Kimble | Aug 8, 2019 | Kimble Charting
Interest rates have declined over 40% in the past 9-months. Could they be near a short-term low? Stocks most likely hope so. This chart looks at the yield on the 10-year note (TNX) over the past 20-years. The majority of the past couple of decades rates have declined...
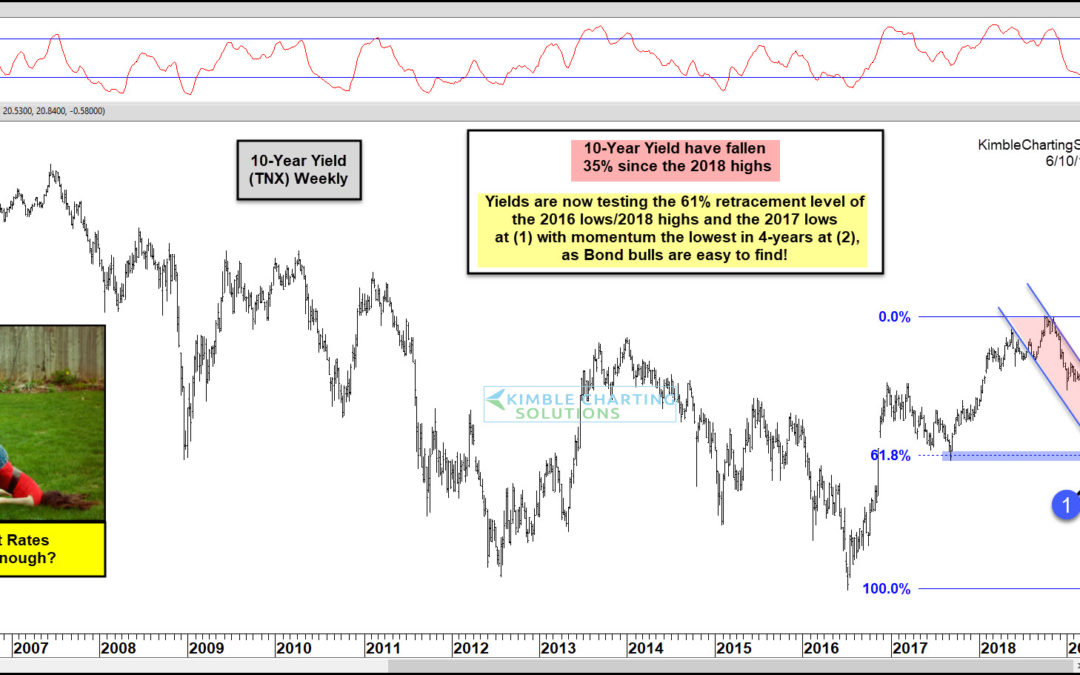
by Chris Kimble | Jun 10, 2019 | Kimble Charting
This chart looks at the Yield on the 10-year note on a weekly basis. Interest rates look to have peaked last October. Since hitting those highs, yields have declined 35%! This large decline has them testing the 2017 lows and its 61% retracement level of the 2016...
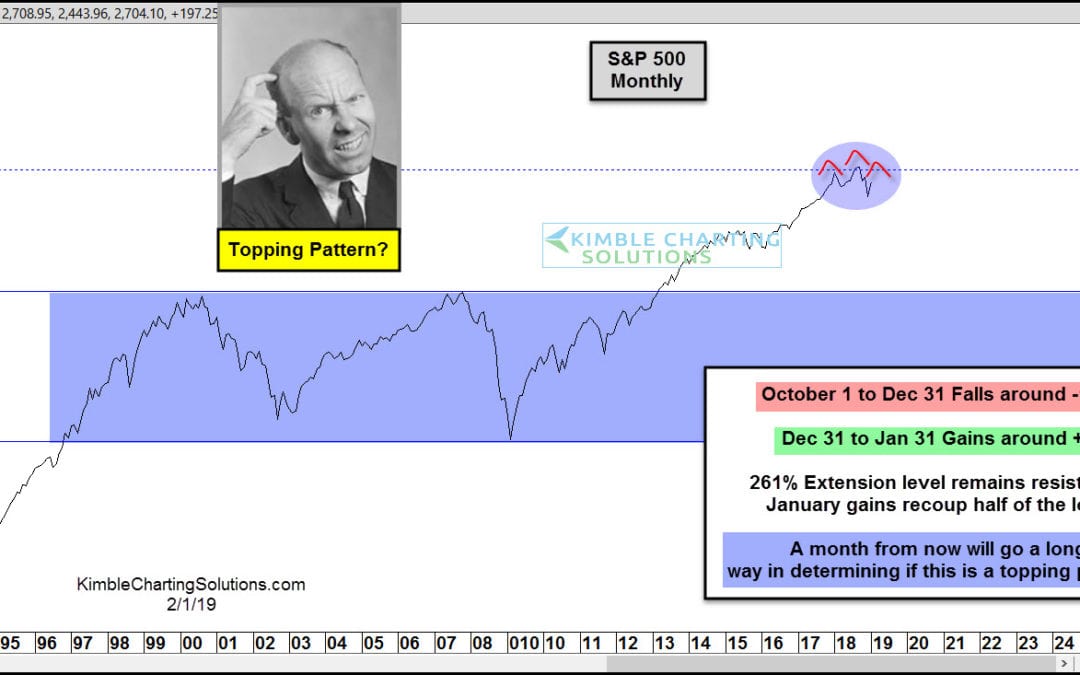
by Chris Kimble | Feb 1, 2019 | Kimble Charting
What a past 4-months its been for the S&P 500! It hits its 261% extension level of the 2007 highs and 2009 lows in late September and it then proceeds to fall nearly 18% in the last 3-months of the year. Following this large decline, the S&P closes the first...
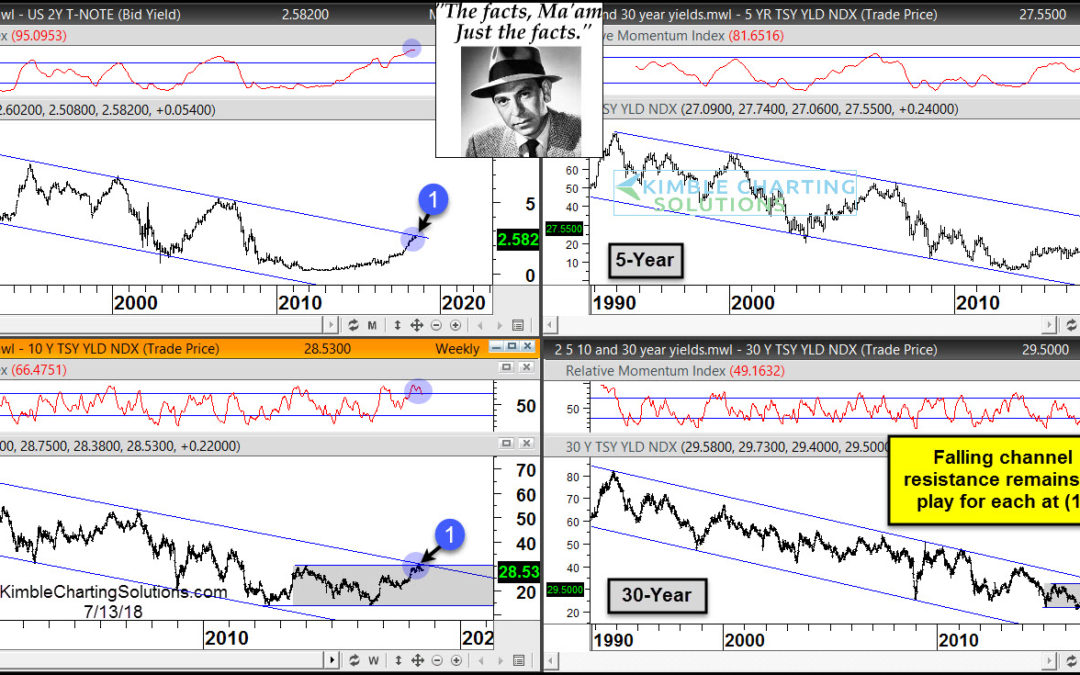
by Chris Kimble | Jul 13, 2018 | Kimble Charting
CLICK ON CHART TO ENLARGE Have interest rates increased over the past couple of years? Yes they have! Have interest rates broken above long-term falling channels? Nope Joe Friday Just The Facts Ma’am- Interest rates (2, 5, 10 & 30-Year yields) are all...
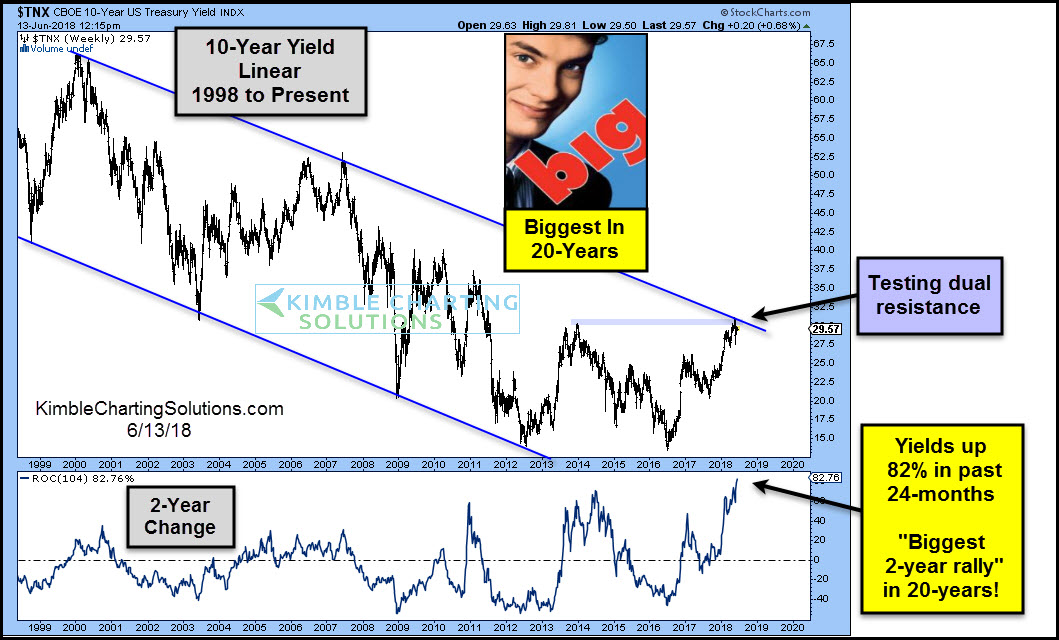
by Chris Kimble | Jun 15, 2018 | Kimble Charting
With the Federal Reserve in interest rate “hike” mode, the market is on edge about the speed with which rates will rise. Rates have been rising at a pretty steady clip over the past couple of years… and apparently, it’s getting investors attention! In fact, the past...
