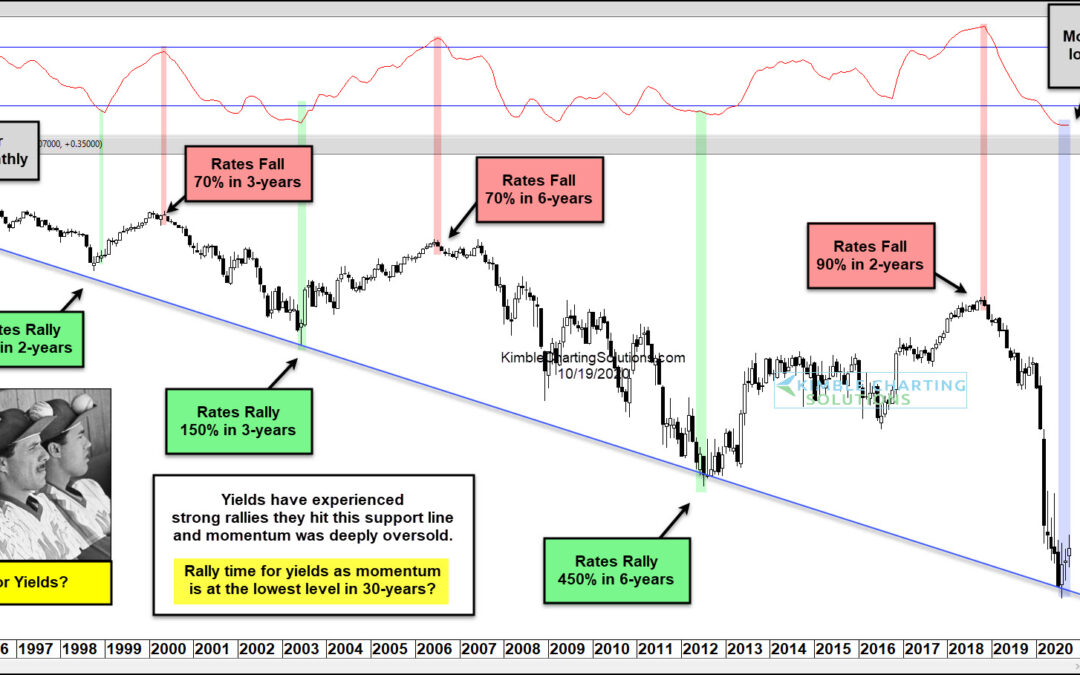
by Chris Kimble | Oct 19, 2020 | Kimble Charting
US treasury bond yields have been trending lower for over 3 decades. Could the latest drop mark a significant low for bond yields and interest rates? In today’s chart, we can see that interest rates have had several spike lows and highs, but that each low is lower and...
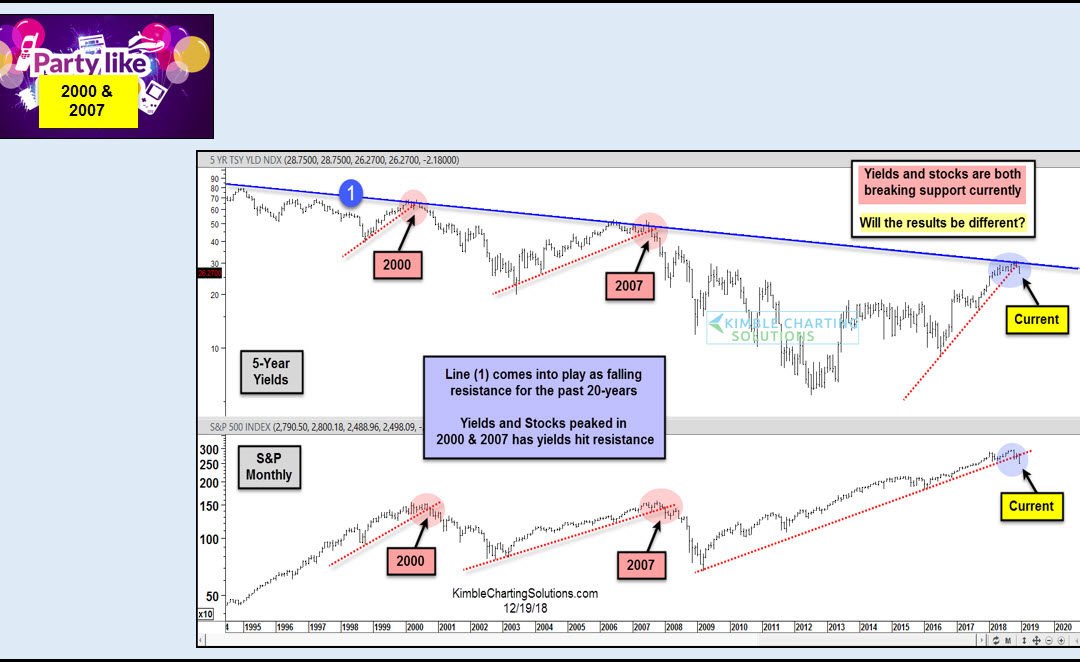
by Chris Kimble | Dec 21, 2018 | Kimble Charting
The stock market correction has morphed into a bear market for the Russell 2000(INDEXRUSSELL: RUT) and Nasdaq Composite (INDEXNASDAQ: .IXIC). The S&P 500 (INDEXSP: .INX) and Dow Jones Industrials are nearing bear market territory, down 15 to 16 percent. Fear is in...

by Chris Kimble | Sep 17, 2015 | Kimble Charting, Sector / Commodity
For some reason, many around the world might be watching interest rates a little closer today, due to the Fed announcement this afternoon. Regardless of what the Fed does this afternoon, how do you make decisions in regards to rates and bond prices. Should you base...
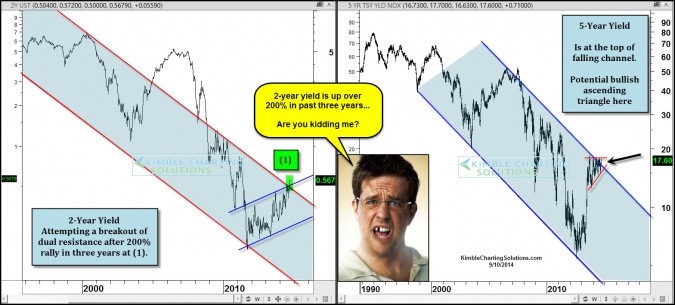
by Chris Kimble | Sep 10, 2014 | Kimble Charting
CLICK ON CHART TO ENLARGE When one looks at the yields on very short term U.S. Government debt, yields on the 2 & 5-year notes are up a big percentage over the past three years. Since 2011, the yield on the 2-year note is up over 200% (.17% to .56%) and the...

by Chris Kimble | Jun 17, 2014 | Kimble Charting
CLICK ON CHART TO ENLARGE Its been a good year for bonds in just six months! Popular bond ETF TLT was up as much as 12% at the start of this month. Most investors would be happy to make 12% in a year owning government bonds. Is the six month rally in bonds...

by Chris Kimble | May 6, 2014 | Kimble Charting
CLICK ON CHART TO ENLARGE Tis the season to hear…”Sell in May and Go away!” This mantra comes from below average performance of stocks during the May to October time frame, compared to stronger stock performance from October to May. ...

by Chris Kimble | Aug 13, 2013 | Kimble Charting
CLICK ON CHART TO ENLARGE A wide variety of bonds have been under pressure since their May highs. This doesn’t just apply to Government bonds! The above 4-pack reflects a cross section of bonds (Govt, High Quality Corp & Junk Bonds) that have been weak...

by Chris Kimble | Aug 1, 2013 | Kimble Charting
CLICK ON CHART TO ENLARGE Wiley Coyote’s sign in the above chart says it best…this is what owners of Government bonds need right now! The Power of the Pattern suggested “Rates were ready to blast off and Bond prices could get hurt big time” due...
