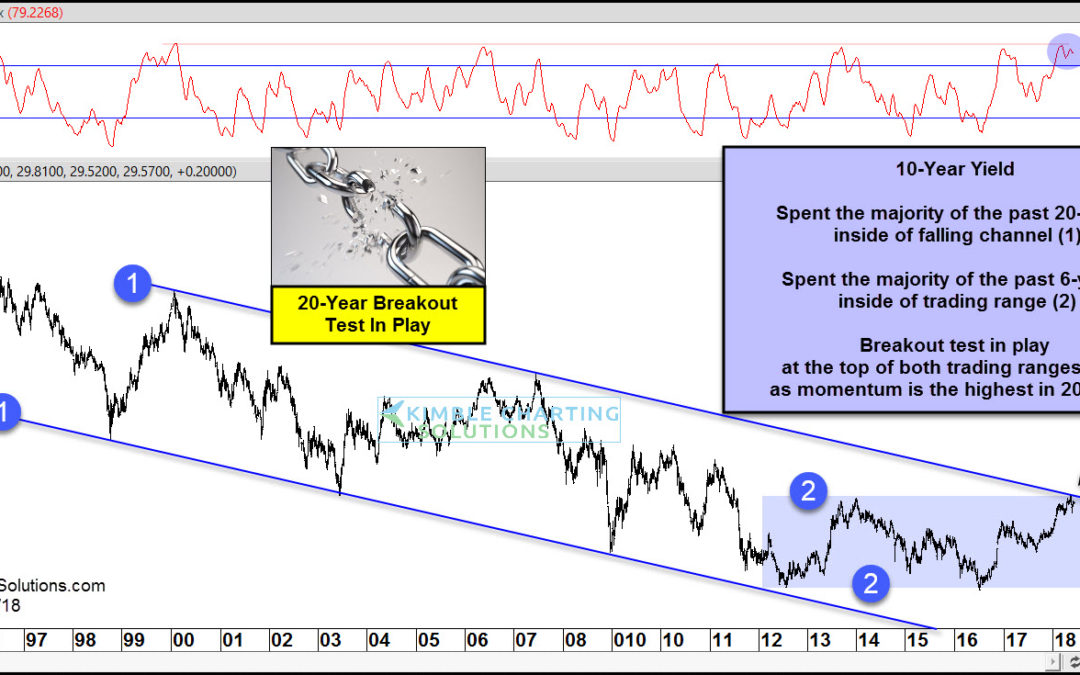
by Chris Kimble | Jun 13, 2018 | Kimble Charting
CLICK ON CHART TO ENLARGE The chart above looks at the yield on the 10-year note (TNX) over the past 25-years. The long-term trend is down as an important trend test is in play currently. The 10-year yield has spent the majority of the past 20-years inside of falling...
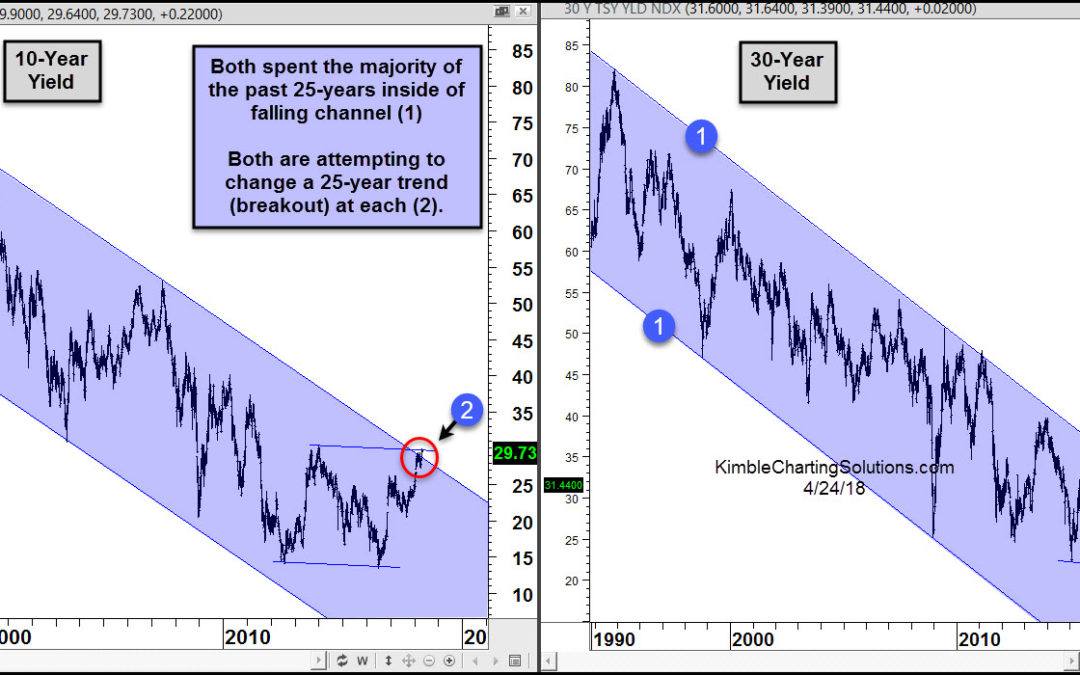
by Chris Kimble | Apr 24, 2018 | Kimble Charting
CLICK ON CHART TO ENLARGE Interest rates have been falling for nearly three decades. Could the trend of lower rates be over? A big test to this trend is in play right now! Above looks at 10 & 30-year yields since early 1990’s. Both have remained inside of...
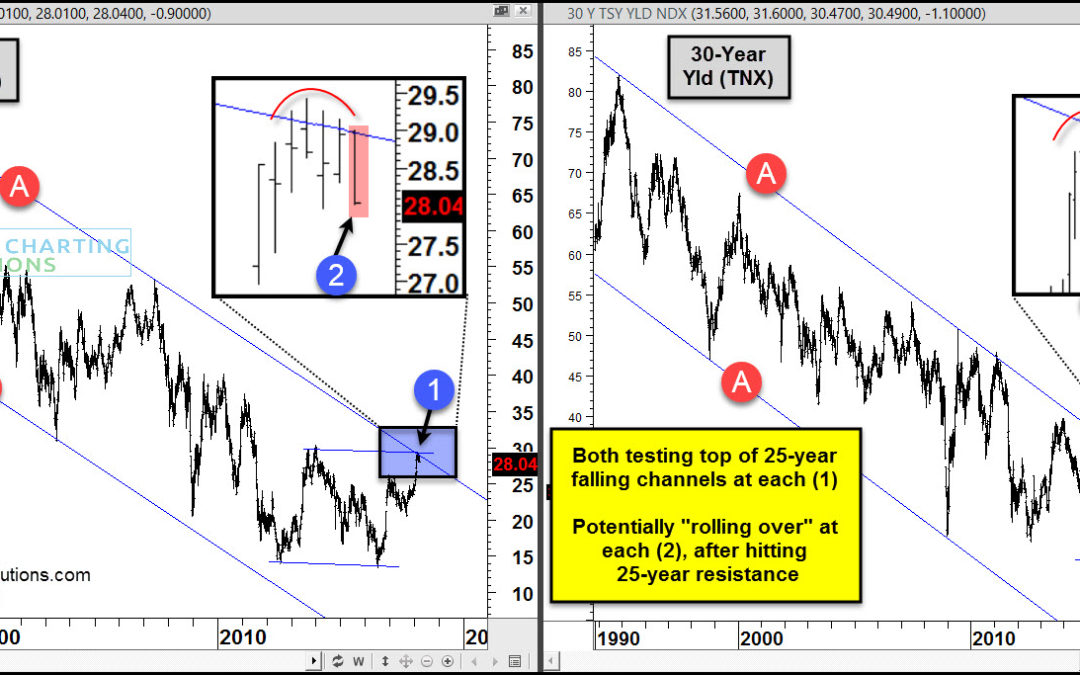
by Chris Kimble | Mar 14, 2018 | Kimble Charting
CLICK ON CHART TO ENLARGE This 2-pack looks at 10-year & 30-year yields over the past 30-years. Both have remained inside of falling channel (A) over the past 25-years. The interest rate rally over the past two years has both of them testing 25-year falling...

by Chris Kimble | Mar 1, 2018 | Kimble Charting
Below looks at 2, 5, 10 & 30-year yields over the past 30-years. Yields remain inside of respective 25-year falling channels. Rallies over the past couple of years has each testing the top of these falling channels. CLICK ON CHART TO ENLARGE When the tops of each...
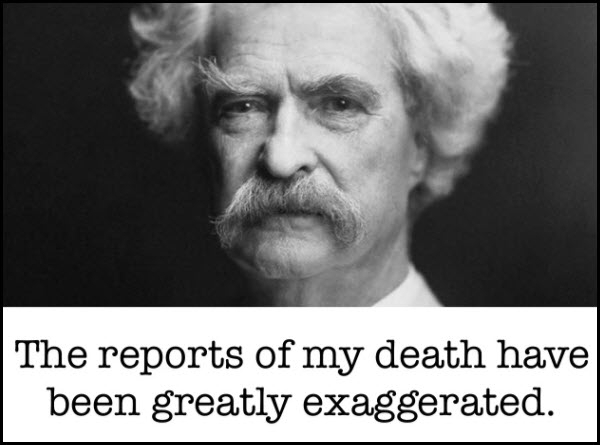
by Chris Kimble | Feb 24, 2018 | Kimble Charting
One of Mark Twain’s famous quotes is “The reports of my death have been greatly exaggerated.” It’s very easy to find people saying the death of the 25-year bond market has already taken place. Has the death of the bond bull actually happened?...
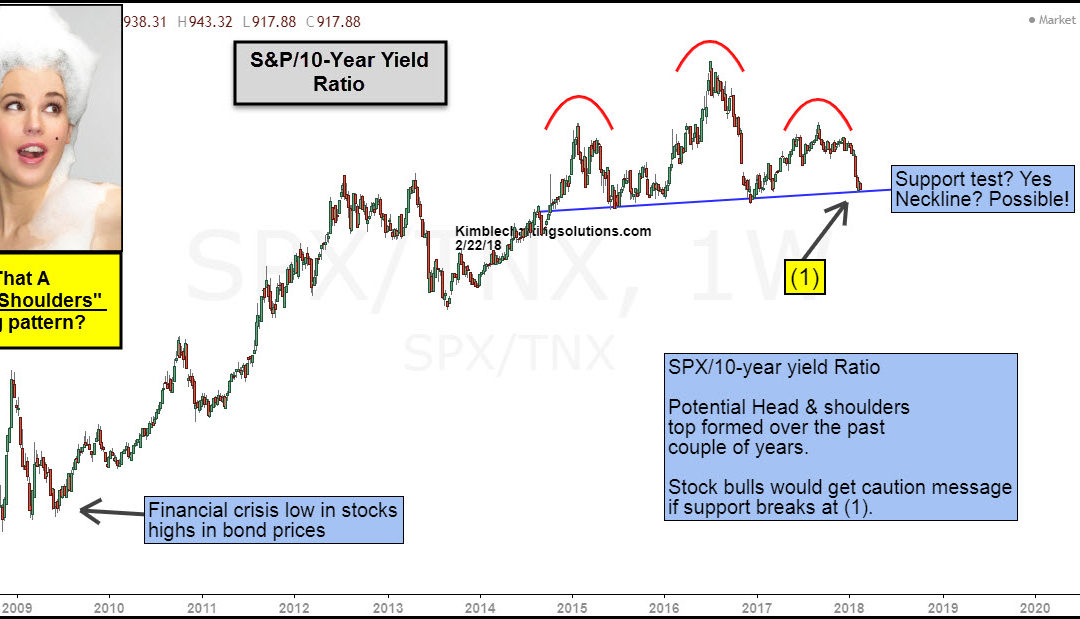
by Chris Kimble | Feb 22, 2018 | Kimble Charting
CLICK ON CHART TO ENLARGE The above chart takes a look at the S&P 500/10-year Yield (TNX) ratio over the past 10-years. At the time of the financial crisis lows, the ratio itself was very low and created a series of higher lows in 2009, before embarking on a...

by Chris Kimble | Feb 13, 2018 | Kimble Charting
Some of our Financial Planning/RIA customers ask us to send them long-term moving averages on a weekly basis, because it helps them make long-term asset allocation decisions. This 6-pack was created to give perspective on a diverse set of assets. It includes...

by Chris Kimble | Feb 8, 2018 | Kimble Charting
Rising interest rates are finally getting some attention here, and by all accounts, investors are concerned! The rate with which treasury yields have moved higher has caught many off guard and may be part of the recent uptick in market volatility. Will interest rates...
