
by Chris Kimble | Jan 12, 2016 | Kimble Charting
CLICK ON CHART TO ENLARGE The Dow has made numerous important highs and lows along rising channel (A) over the past 70-years. The last two times channel line (A) was really important was at the 2002/03 lows and right before the big decline around the world in 2008....

by Chris Kimble | Jan 11, 2016 | Kimble Charting
CLICK ON CHART TO ENLARGE Let’s start the week of with a “Macro Monday” perspective. The above chart looks back on the S&P 500 for the past couple of decades. The S&P 500 has remained inside of rising channel (A) for a good while. If...

by Chris Kimble | Jan 8, 2016 | Kimble Charting
CLICK ON CHART TO ENLARGE Junk bonds have been in the news a ton over the past few months, mostly in a bad way, as they have been falling in price since April of 2014. The chart above looks at the Junk Bond (HYG)/S&P 500 ratio. As you can see, the ratio has been...
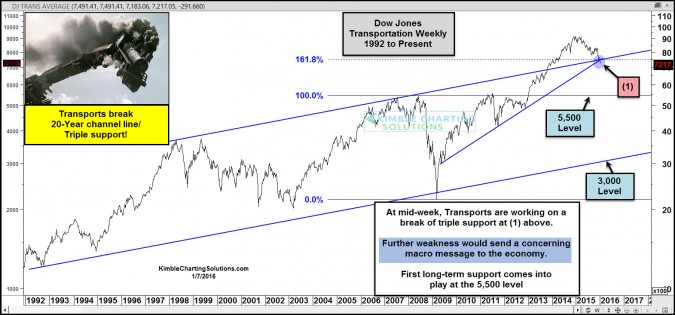
by Chris Kimble | Jan 7, 2016 | Kimble Charting
CLICK ON CHART TO ENLARGE On New Years Eve (before global weakness was taking place), the Power of the Pattern warned investors of a “Slipping Hazard” in the Transport index, as it was near a key breakdown, which could ripple into the broad markets. See...
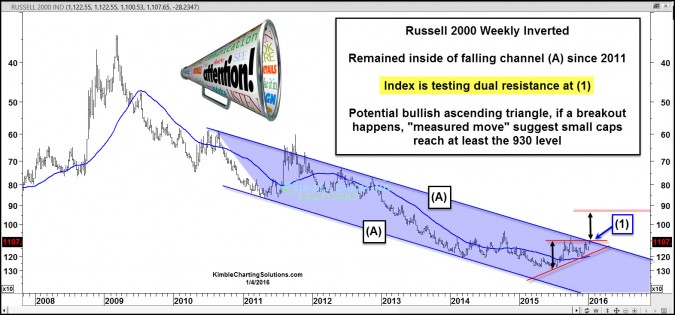
by Chris Kimble | Jan 6, 2016 | Kimble Charting
This article was first shared on See It Market.com The Russell 2000 and small caps stocks spent 2015 largely underperforming their large cap brethren (i.e. the S&P 500). And that has brought the Russell 2000 Index (RUT) to a critical test. In fact, this could be...

by Chris Kimble | Jan 4, 2016 | Kimble Charting
CLICK ON CHART TO ENLARGE The rally over the past few years has taken the Nasdaq 100 back to levels last seen at the heights of the Dot.com bubble in 2000. At the same time the NDX 100 is hitting its 2000 highs, monthly momentum is hitting levels last seen in 2000....

by Chris Kimble | Dec 14, 2015 | Kimble Charting
The “Big Bull Trend” is near a key test of rising support! Below looks at the S&P 500 and the DAX Index (Germany) over the past 4-years. CLICK ON CHART TO ENLARGE The Power of the Pattern reflects that the S&P 500 and DAX both remain inside of...

by Chris Kimble | Nov 2, 2015 | Kimble Charting
CLICK ON CHART TO ENLARGE A month ago the S&P 500 created the “largest reversal pattern (bullish wick)” since THE low in 2011. We shared this reversal pattern with our members the following morning in our weekly wrap up report called “Coffee With...
